Lighthouse Recommendations
Lighthouse Improvement Opportunities shows the failed audits from your Lighthouse report, grouped into Opportunities (audits with potential byte or time savings) and Diagnostics (other audits that flag issues). Each audit shows its score, a severity indicator, and any estimated savings. You can expand an audit to read the Lighthouse details and, once generated, the AI-recommended fix for that specific audit.
Let's get started!
Open the performance section of your report test report by clicking on performance in the left menu.
Scroll to the Lighthouse Improvement Opportunitiessection at the bottom of the report. You can also use the section anchor link if available.
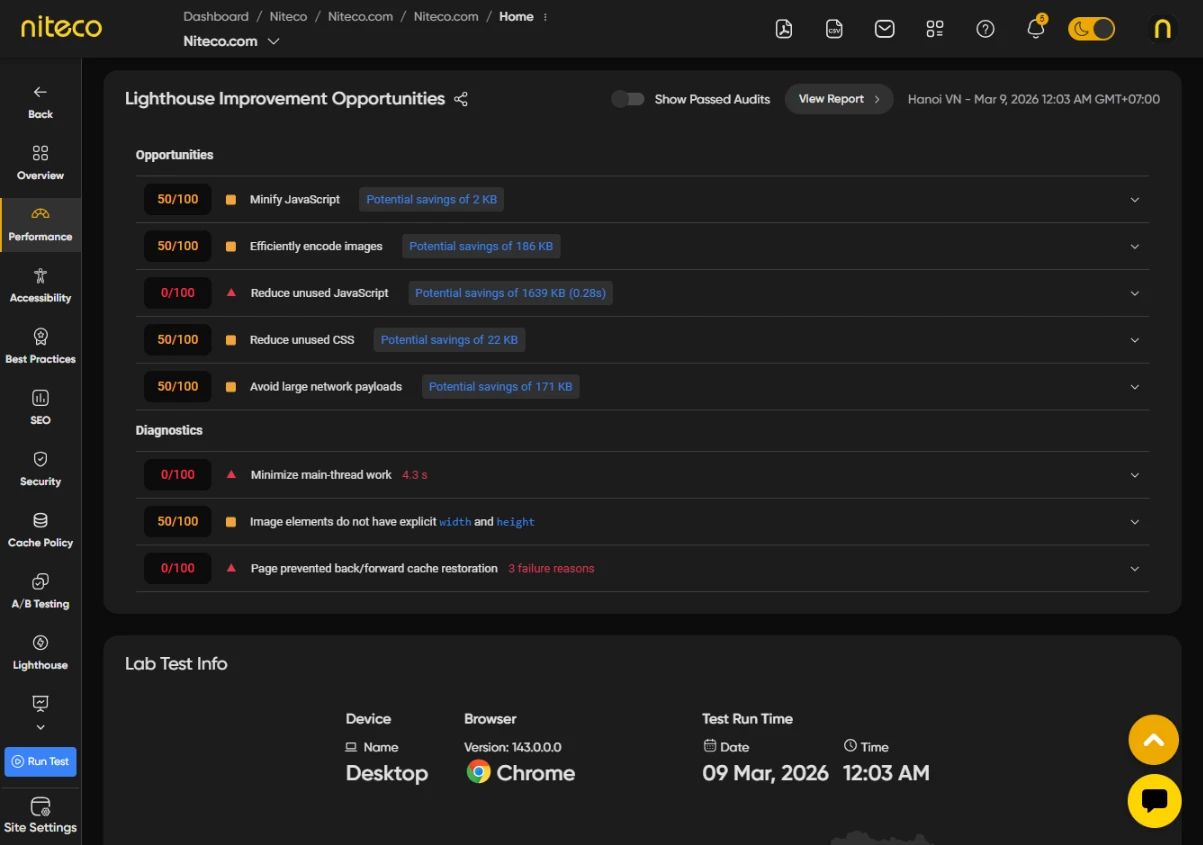
Audits are split into two groups. Opportunities are audits of type opportunity — these directly reduce load time. Diagnostics are other failing audits that identify issues without a direct size saving.
Each failed audit appears as a row showing:
- Score badge – the audit score out of 100, colored red (failing) or orange (needs improvement).
- Severity icon – a triangle (failing) or square (needs improvement) next to the score.
- Audit title – the name of the audit, with inline code terms highlighted.
- Potential savings – shown in a blue pill when the audit estimates byte or time savings (for example,
Potential saving 120 KBorPotential saving 0.4s).
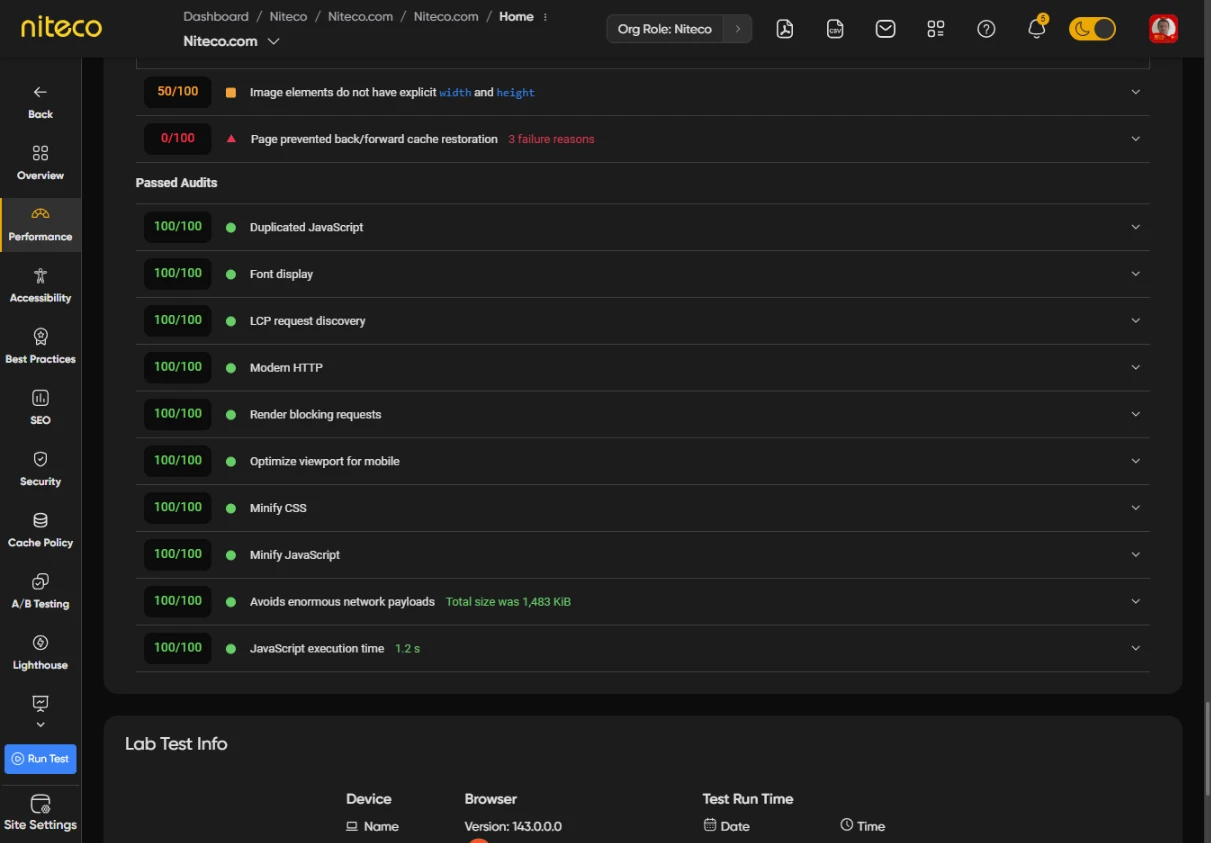
Use the Show Passed Audits toggle in the card header to also show audits that passed (score = 100).
2. Analyzing an Audit
Click on an audit row to expand it. The expanded area has two collapsible sub-sections.
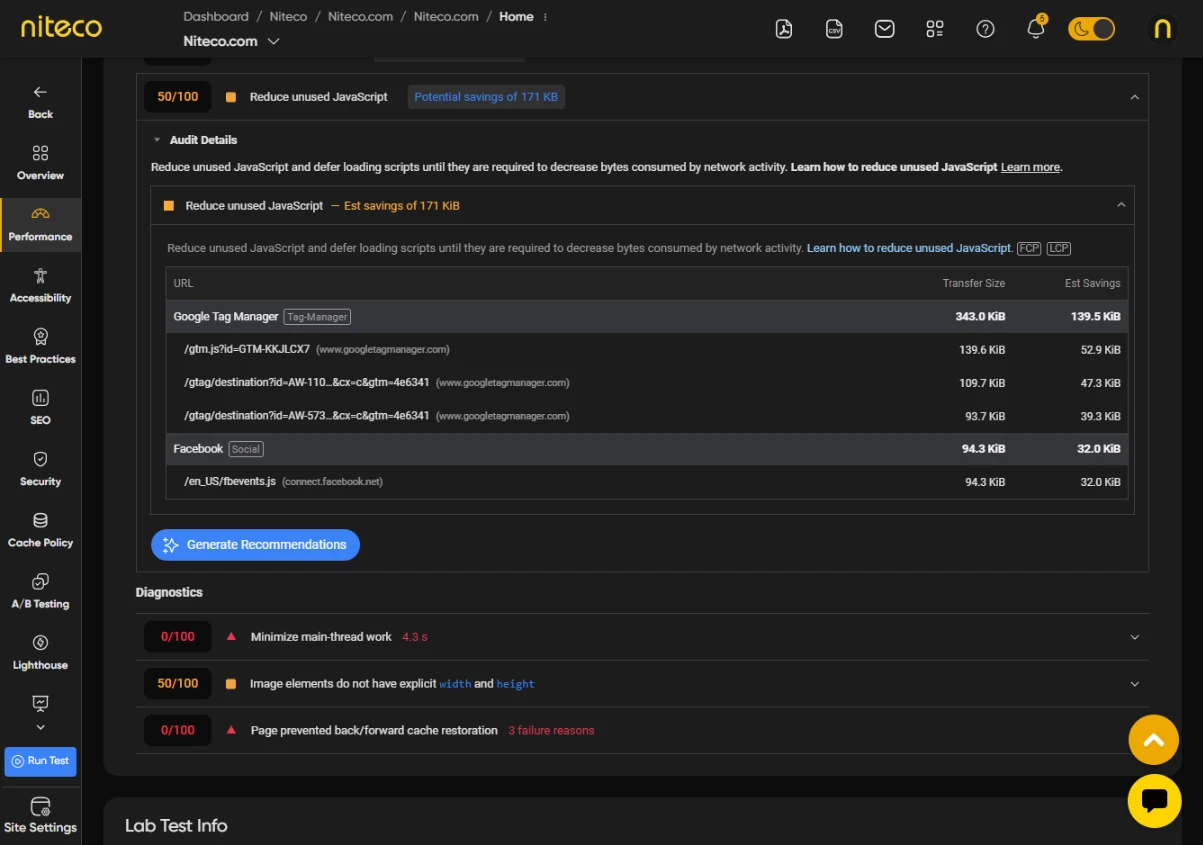
Audit Details shows the Lighthouse description for that audit and, when available, the native Lighthouse table (affected resources, URLs, or DOM nodes from the full report). Click the Audit Details header to collapse or expand it.
Click View Report in the card header to open the full Lighthouse HTML report for the selected test, where you can see all audit detail tables in the original Lighthouse layout.
3 Generate Recommendations
You can generate AI recommendations for all failed audits, which offer solutions that include practical code examples to help you improve the your lighthouse scores . When no recommendations have been generated yet, each audit row shows a Generate Recommendations button:
While the analysis runs, a loading animation is shown and the button label changes to Generating.... The analysis runs in the background — you can continue using the report. When it completes, the recommendations appear automatically.
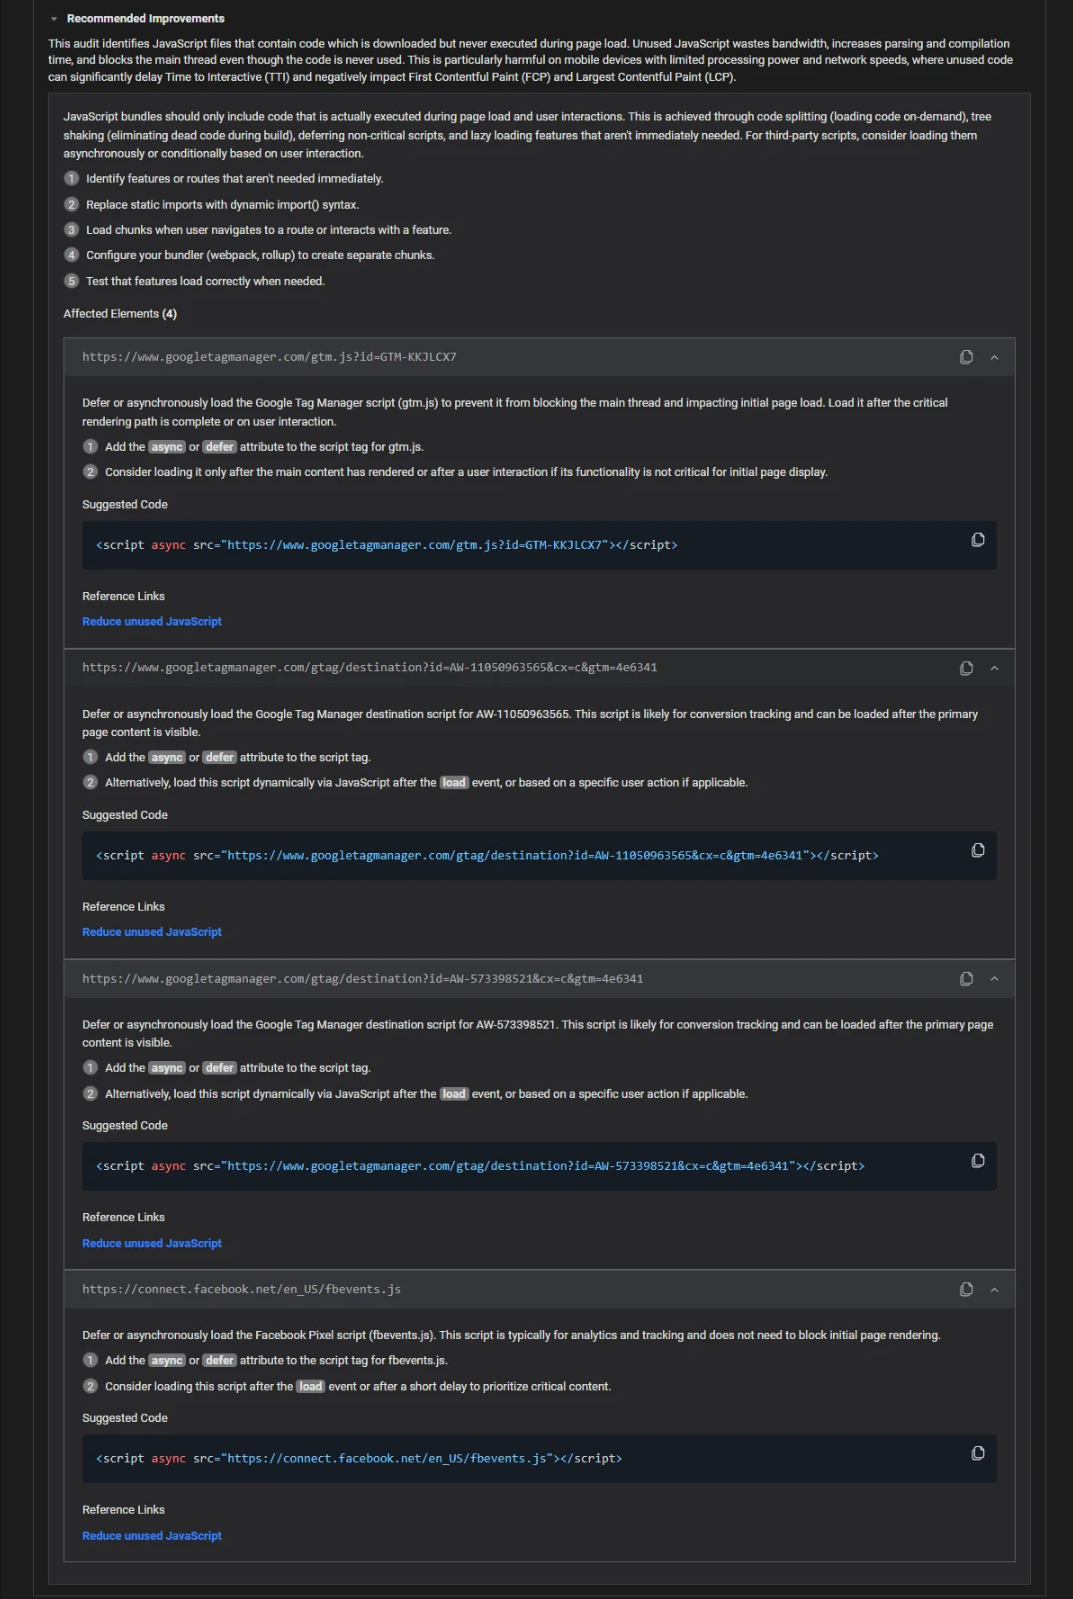
Inside an expanded audit (in the Audit Details tab), the Recommended Improvements sub-section appears below Audit Details. It contains:
- A description of what the issue is and why it matters.
- The affected element (selector or URL).
- An optional code snippet showing the current problem.
- A solution step explaining what to change.
- An code fix (where applicable) showing the changes to code. needed to improve the audit score.
- Reference links when available — external documentation for further reading.
Each audit row with a recommendation has a copy icon button on the right side of the row header. Clicking it copies the audit title, score, description, solution, and all item details (selector, snippet, solution, code fix) to the clipboard as plain text. A confirmation snackbar confirms the copy.
5. PDF Export
When exporting a report as a PDF, select Lighthouse Improvement Opportunities to include the generated improvement opportunities.
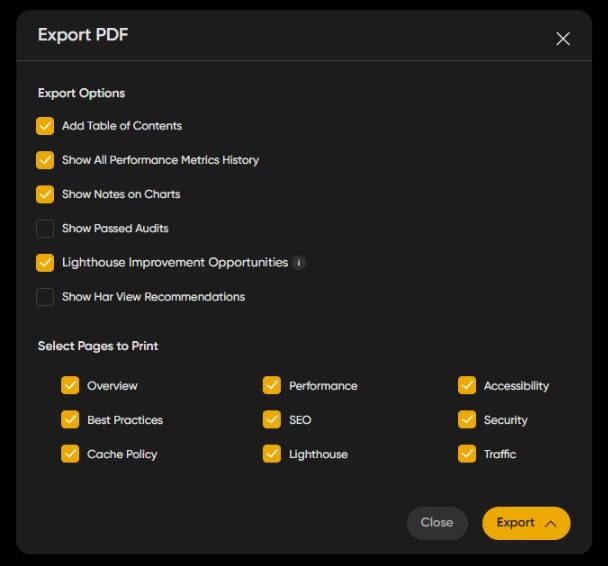
Lighthouse Improvement Opportunities – when checked, expands all audit accordions and includes the improvement opportunities section in the PDF.
Show Passed Audits – when checked, the passed audits group is included in the PDF alongside the failed ones.
Updated about 2 months ago