Web Vitals
Web Vitals are a set of user-centered metrics introduced by Google that focus on various aspects of web performance, particularly related to loading, interactivity, and visual stability. These metrics are:
Largest Contentful Paint (LCP)
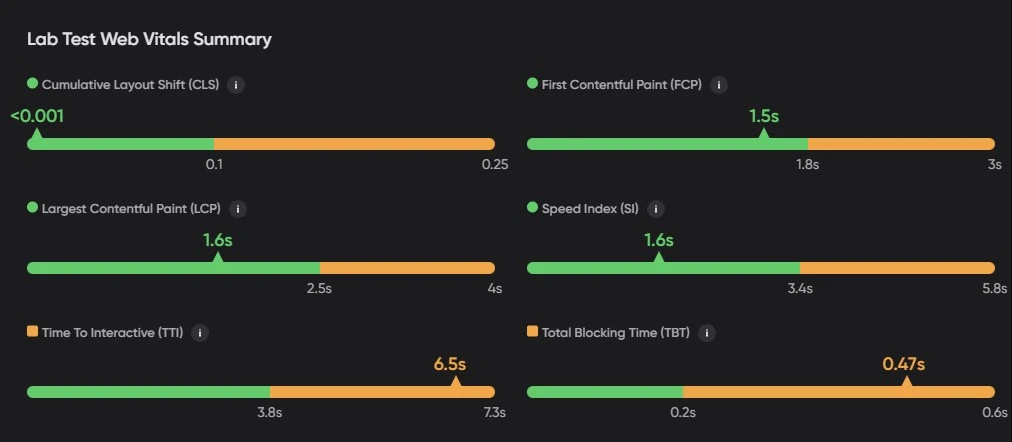
LCP measures the time it takes for the largest visible content element (such as an image or text block) to load on the page. A good LCP score should be under 2.5 seconds to ensure a smooth user experience. Optimizations to improve LCP include enhancing server response times, compressing images, optimising CSS, and minimizing Javascript Blocking.
Interaction to Next Paint (INP)
INP is the Core Web Vital for responsiveness. It measures the delay from a user’s interaction (click, tap, key press) until the next paint. INP considers all interactions during the page’s lifecycle and uses the worst (or near-worst) value. A good INP is under 200 milliseconds so the page feels responsive. To improve INP, reduce JavaScript main-thread work, break up long tasks, and defer or optimize non-critical scripts.
InfoINP has replaced First Input Delay (FID) as the official Core Web Vital for responsiveness. FID only measured the first interaction; INP reflects responsiveness across the full page lifecycle. Use INP when you look at field data (e.g. CrUX). Lab tools may still report FID; for real-user responsiveness, rely on INP.
Cumulative Layout Shift (CLS)
CLS measures the Visual Stability of a page, tracking unexpected layout shifts during the loading process. A good CLS score should be below 0.1 to avoid frustrating users. Common fixes include setting size attributes for images and ads to prevent sudden shifts and avoiding the injection of dynamic content above existing content.
Additional Performance Metrics
In addition to Core Web Vitals, other performance metrics provide deeper insights into how a website loads and responds to user interactions.
First Contentful Paint (FCP)
FCP measures the time from when the page starts loading to when any part of the page’s content is rendered on the screen. A fast FCP (under 1.8 seconds) gives users early visual feedback that the page is loading. Improvements to FCP include reducing server response time, optimizing CSS delivery, and reducing render-blocking resources.
Speed Index (SI)
SI measures how quickly the content of a page is visibly populated. A lower Speed Index indicates that the visible parts of the page load faster. SI can be optimized by reducing the size of above-the-fold content, leveraging lazy loading for below-the-fold content, and minimizing the impact of third-party scripts.
Time to Interactive (TTI)
TTI measures how long it takes for a page to become fully interactive after loading. This means that the page is fully usable, with no long tasks preventing user interaction. A good TTI score should be under 5 seconds. To improve TTI, reduce JavaScript execution time, defer non-critical scripts, and prioritize rendering of critical content.
Total Blocking Time (TBT)
TBT measures the amount of time that the page is blocked from responding to user input (such as mouse clicks or keyboard input) due to long tasks. TBT is closely related to TTI, and a lower TBT (ideally under 300 milliseconds) indicates better interactivity. You can reduce TBT by minimizing JavaScript execution, breaking up long tasks, and using code-splitting techniques.