Traffic
Traffic metrics in Niteco Performanc Insights are derived from Google Analytic reports. Google Analytics provides detailed insights into website and app traffic, user behavior, and audience demographics. It allows website owners, marketers, and app developers to track, analyze, and measure various aspects of their online presence. Google Analytics helps businesses understand how users interact with their websites or apps, enabling data-driven decision-making for marketing, content optimization, and user experience improvements.
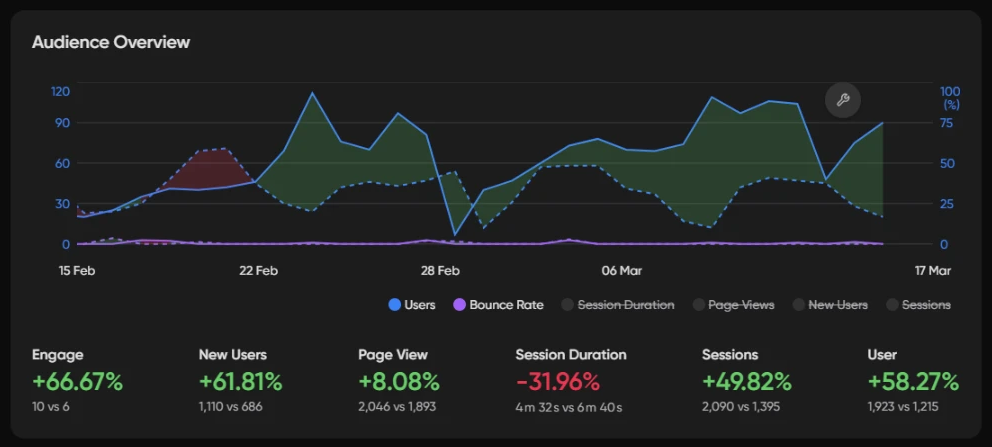
Key traffic metrics included in reports:
User Metrics
Users
The total number of unique visitors to your website during a specified time period.
New Users
The number of first-time users visiting your site during the selected date range.
Returning Users
The number of users who have previously visited your website and returned within the specified time period.
Session Metrics
Sessions
A session is a group of interactions that a user takes within a given time frame on your website. A single session can contain multiple page views, events, social interactions, and transactions.
Engaged Sessions
The total number of sessions that lasted longer than 10 seconds, had a conversion event, or had multiple page views.
Average Session Duration
The average length of time users spend on your site during a session.
Traffic Source Metrics
Channel
The categorization of your traffic sources, including channels like organic search, paid search, direct, referral, and social.
Source
The origin of your website traffic, which could be a search engine, a domain, or a campaign.
Medium
The general category of the source, such as organic, CPC (cost per click), or referral.
Engagement Metrics
Pageviews
The total number of pages viewed on your website. Repeated views of a single page are counted.
Unique Pageviews
The number of sessions during which a specified page was viewed at least once.
Average Page Depth
The average number of pages viewed during a session. This metric shows how engaged users are with your content.
Conversion Metrics
Goals
Metrics related to specific user actions you want to track, such as completing a form or making a purchase.
Goal Conversion Rate
The percentage of sessions that resulted in a goal completion.
E-commerce Conversion Rate
The percentage of sessions that resulted in an e-commerce transaction.
Behavior Metrics
Bounce Rate
The percentage of single-page sessions in which the user left without interacting with the page.
Exit Rate
The percentage of exits from a particular page, indicating how often users leave your site from that page.
Site Speed
Metrics related to the load times of your website, affecting user experience and SEO.
Demographic Metrics
Location
The geographic location of your users, providing insights into where your traffic originates.
Language
The languages spoken by your users, based on their browser settings.
Device Metrics
Device Category
The type of device used to access your website, categorized as desktop, mobile, or tablet.
Operating System
The operating system used by your visitors, which can help optimize your site for different environments.
Browser
The web browser used by visitors to access your site, useful for ensuring compatibility.
Custom Metrics
Custom Events
User-defined interactions that you track, such as button clicks, video plays, or form submissions.
Custom Dimensions
Additional attributes you can assign to your data to gain more insights, such as user roles or content types.