Microsoft Power BI
The integration of Niteco Performance Insights with Microsoft Power BI — a powerful way to visualize and analyze your website performance data.
With this integration, you can easily import synthetic monitoring data, web vitals, and real user metrics from Niteco Performance Insights directly into Power BI. This enables you to create custom dashboards, generate interactive reports, and monitor trends over time — all in one centralized platform.
Why Integrate with Power BI?
- Enhanced Data Visualization: Turn complex performance metrics into easy-to-understand charts and graphs.
- Custom Dashboards: Build personalized views tailored to your business needs and performance KPIs.
- Automated Reporting: Schedule data refresh and automate reporting for stakeholders.
- Data Correlation: Combine performance data with other business metrics in Power BI for a holistic view.
What You Can Track
- Full Lighthouse Data: Performance, Accessibility, Best Practices, and SEO scores across devices and locations
- Complete Lab Web Vitals Data: Including CLS, FCP, LCP, SI, TTI, TBT, and other metrics such as Visual Complete and Page Load
- Historical Performance Trends
How It Works
The integration uses the Niteco Performance Insights API to pull data into Power BI. With a few simple steps, you can connect, extract, and visualize your data.
Steps To Connect
- Login to your PowerBI and select “Blank report”
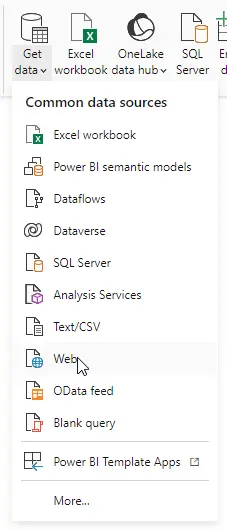
- Click on “Get data” option in the ribbon and select “Web” option
- From the popup display, select “Advanced” option
- “URL parts” field, fill in “https://perf.niteco.com/api/v1/tests/full?”
- “HTTP request header parameters” field, enter “x-api-key” and its value is the access token key from the tool Find your API key
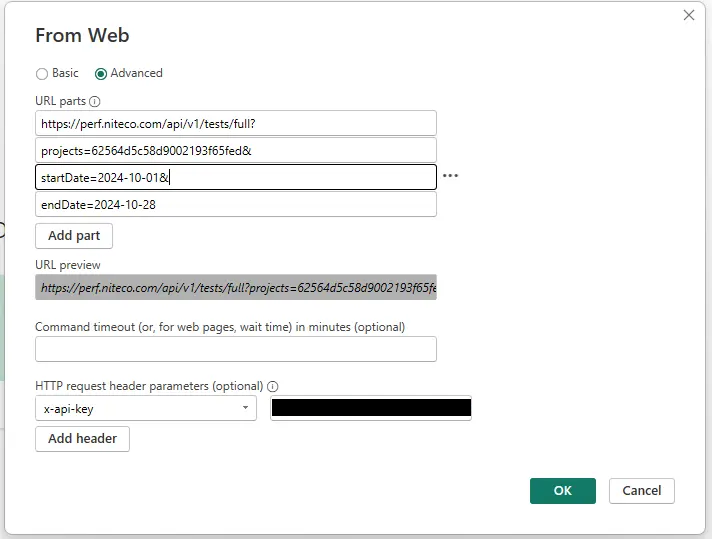
- Click on “OK” button to finish
- For first-time data access– In the “Access Web Content” popup, select Anonymous (default) and choose “https://perf.niteco.com/api/v1” from the dropdown list.
(This helps distinguish it from other PerfMon APIs if any exist. You can update this selection in the settings later.)
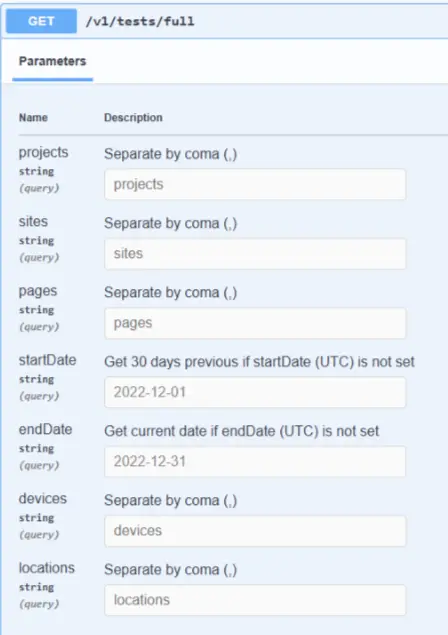
v1/tests/full parameters
To narrow the data return, users can add the following parameters in the "From Web" form
Name | Data | Note |
|---|---|---|
| projects | project IDs | Allow multiple projects in the same client (separate by coma) |
| sites | site IDs | Allow multiple sites in the same project (separate by coma) |
| page | page IDs | Allow multiple sites in the same site (separate by coma) |
| startDate | YYYY-MM-DD | If no date is provided, the default value will be the last 30 days (UTC time) |
| endDate | YYYY-MM-DD | If no date is provided, the default value will be the last 30 days (UTC time) |
| device | device IDs | Allow multiple devices (separate by coma) |
| locations | *location IDs | Allow multiple locations (separate by coma) |
*List of location IDs: USEastCoast, USWestCoast, Canada, CanadaWest, Brazil, Sweden, Ireland, France, Germany, Italy, Spain, SouthAfrica, UAE, Israel, Hanoi, Singapore, Australia, Indonesia, Malaysia, Japan, Korea, India, and HongKong
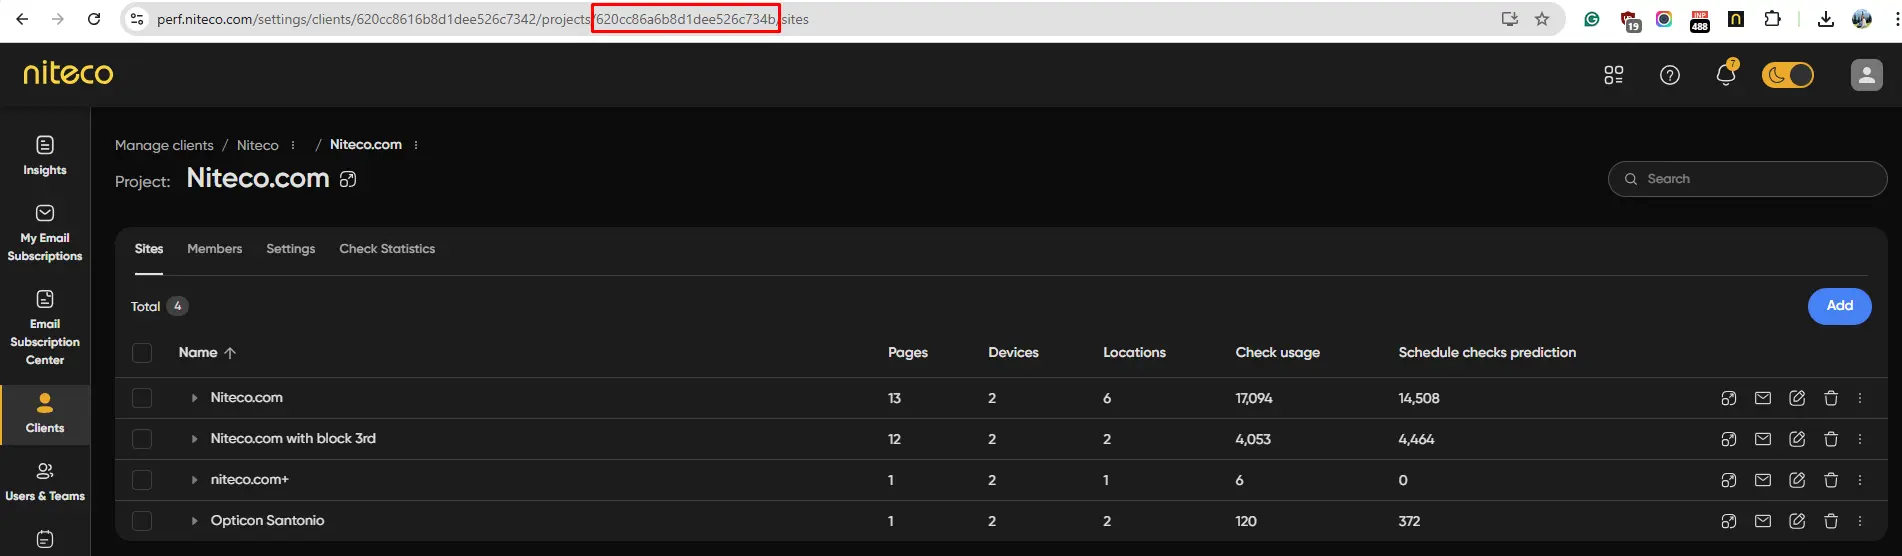
How To Get Project ID
- Login to the webapp
- On the Dashboard, find your project and select “Edit project” button
- In the URL, select the ID after the /projects/
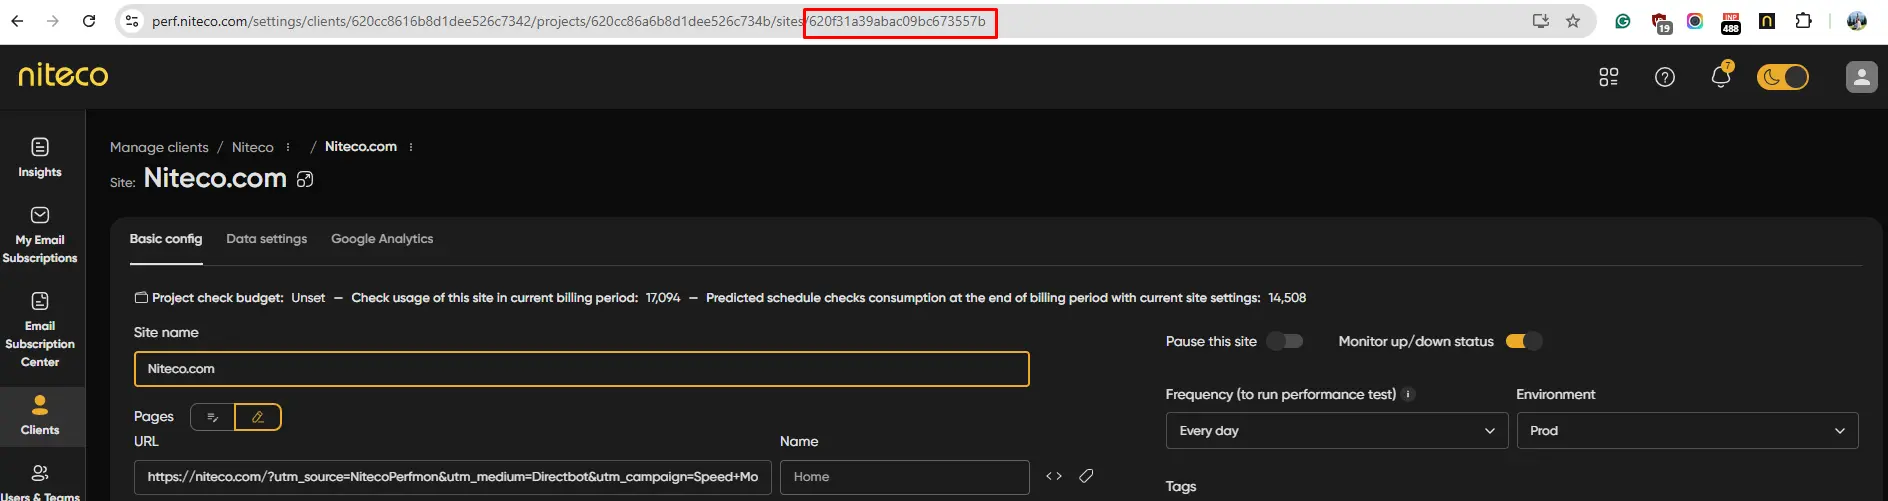
How To Get Site ID
- Login to the webapp
- On the Dashboard, find your site and select “Edit site” icon
- In the URL, select the ID after the /sites/
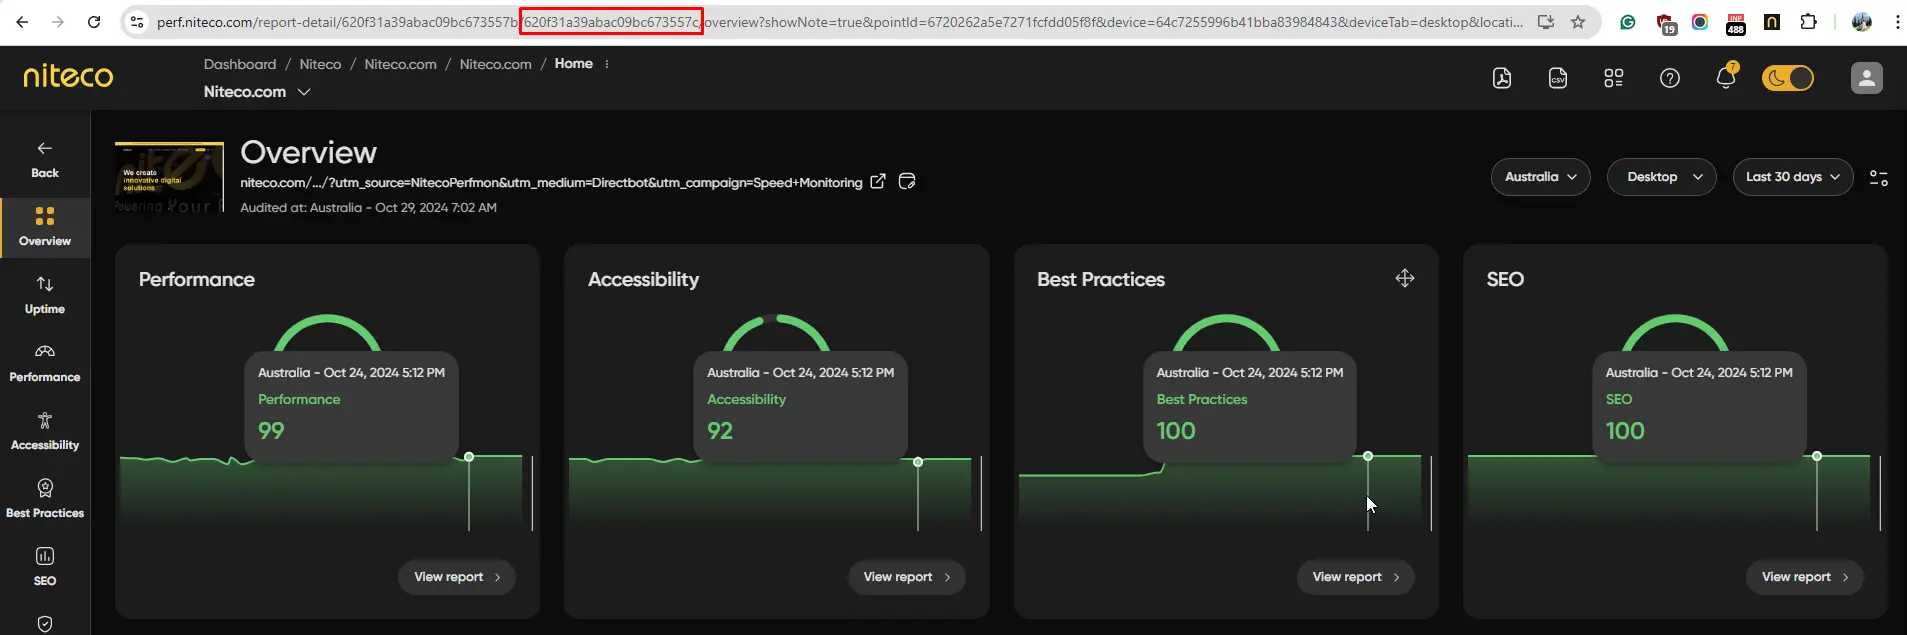
How To Get Page ID
- Login to the webapp
- On the Dashboard, select a test point to open the Overview screen
- In the URL, select 2nd ID
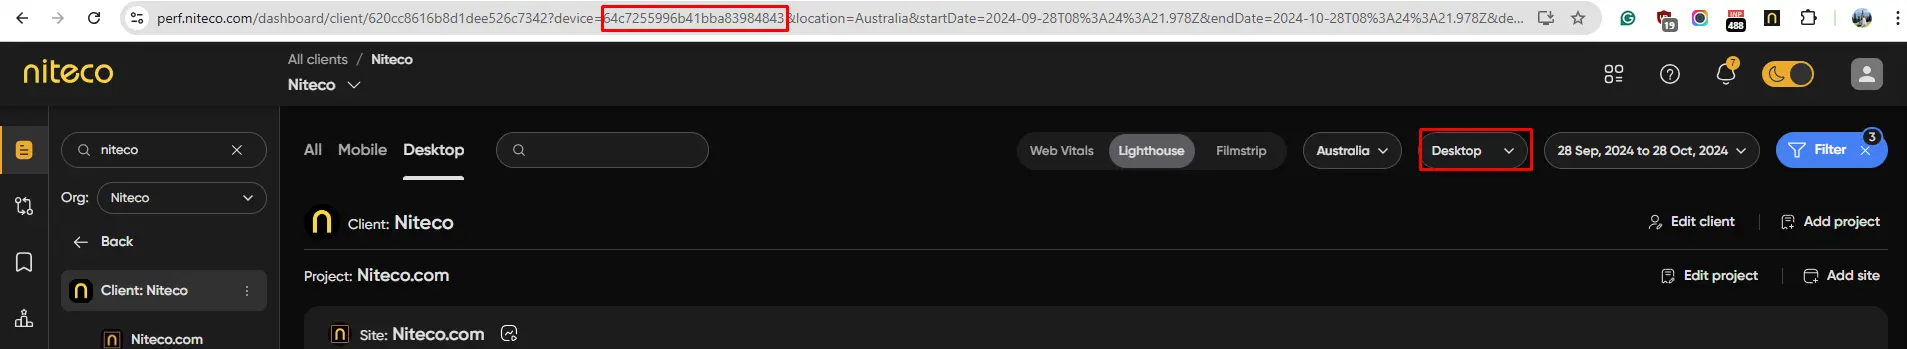
How To Get Device ID
- Login to the webapp
- On the Dashboard, device filter, select a device
- In the URL, select the ID after the ?device=