Debugging with the Harview
The HAR view (browser waterfall) in a performance report shows every request the page makes: URLs, timing, size, and type. You can adjust how the waterfall is shown, inspect individual requests in the request detail panel (Summary, Headers, Certificate, HTML Source), and run an AI analysis to get fix suggestions for slow or problematic resources. This is extremely useful for tracking down what is slowing the page, which requests block rendering, and how to optimize images, scripts, or third-party calls.
1. Open the HAR View
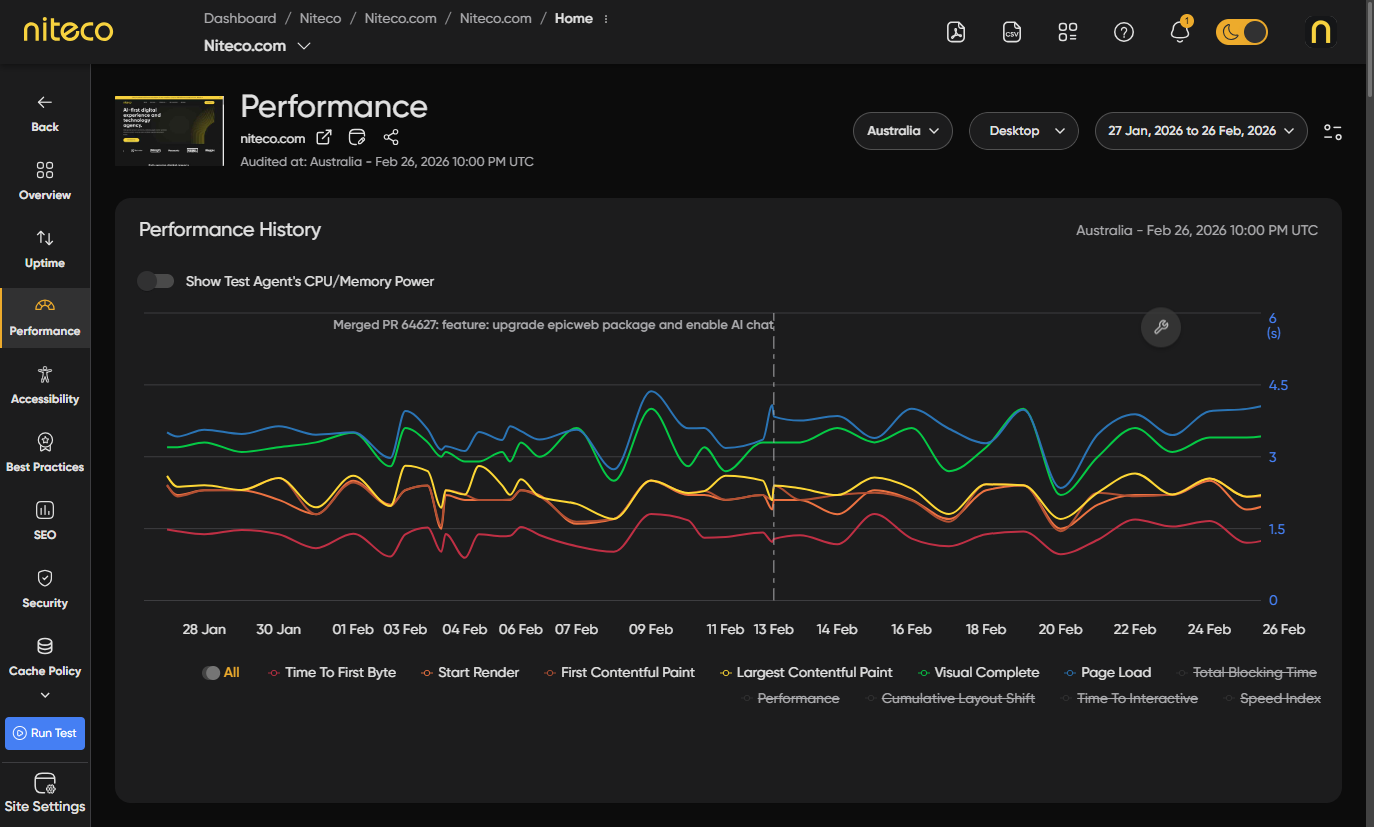
Open the performance section of your report test report by clicking on performance in the left menu.
Scroll down to the browser waterfall section and click on Expand to show the detailed network chart.
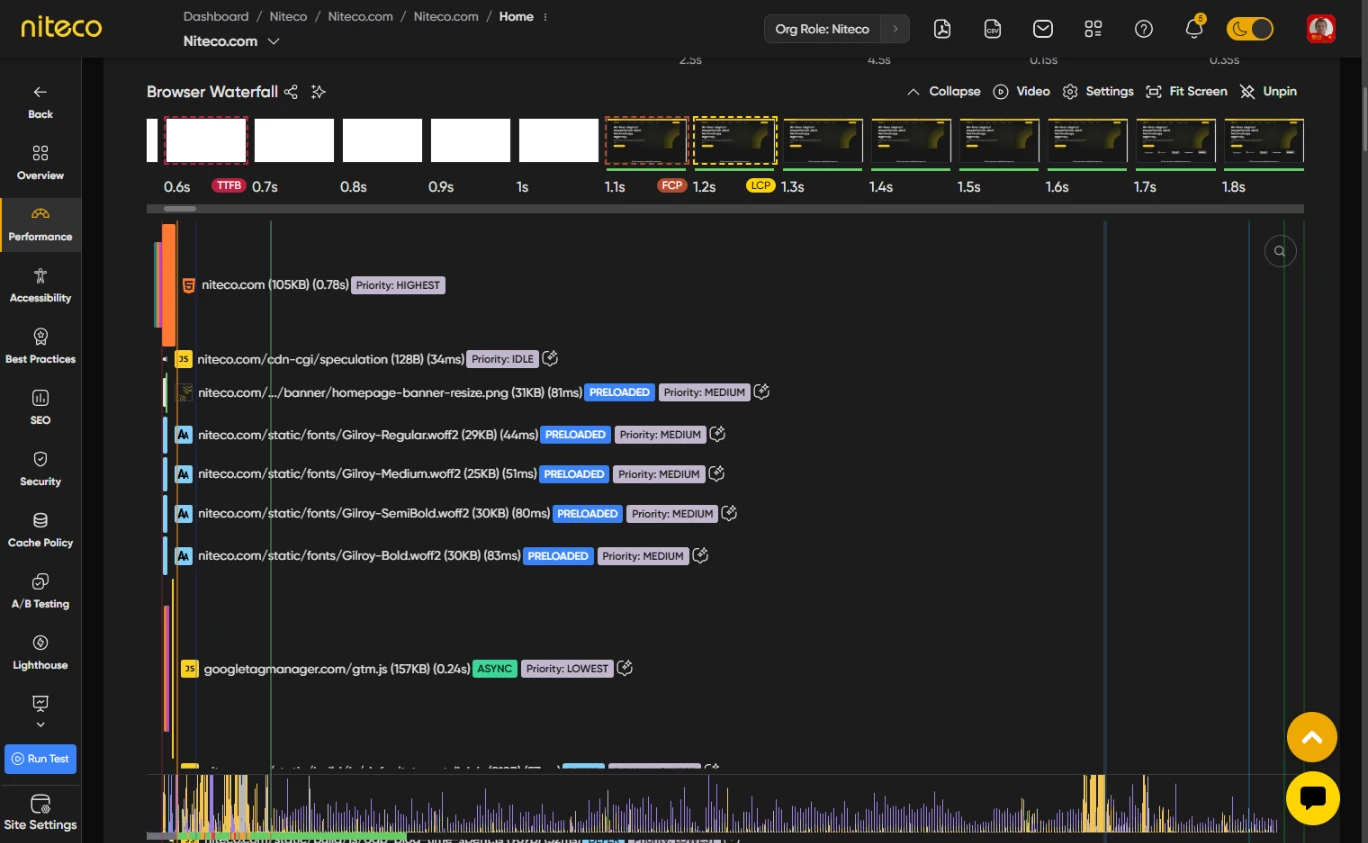
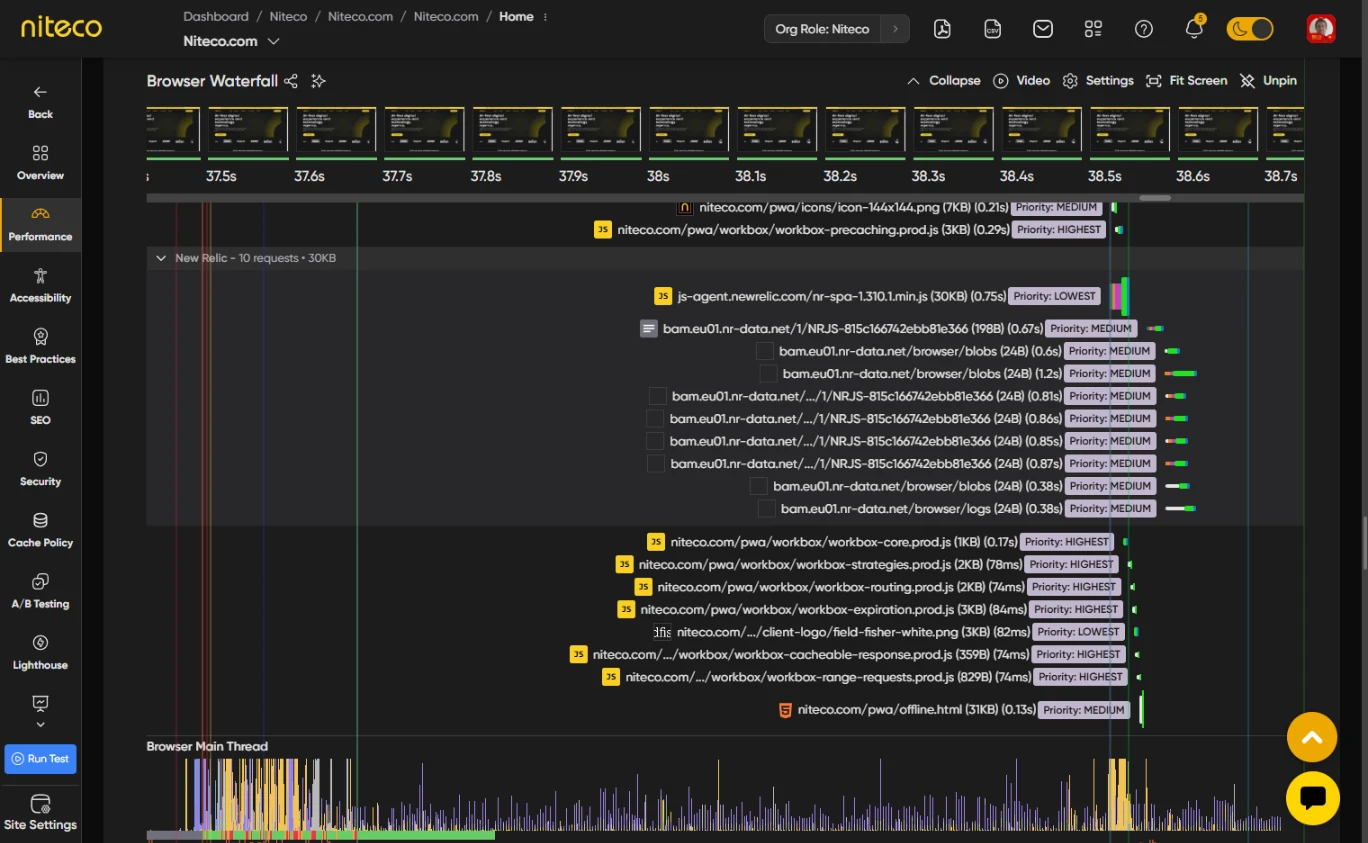
You will see a waterfall of request bars. Each bar is a request (document, script, image, style, etc.) with its URL, timing, and size. Use the toolbar to adjust the view or open Settings for more options.

2. Toolbar
The Browser Waterfall Toolbar allows you to...
Expand / Collapse – Show or hide the network chart.
Video – Play the test recording for this run (when available).
Settings – Open the Options panel to change how the waterfall is displayed (see section 4).
Fit screen – Resize the chart to fit the visible area.
Pin – Keep the toolbar fixed at the top when you scroll._
3. Inspect a Request
Click on a request bar to open the request detail panel. The panel has tabs:
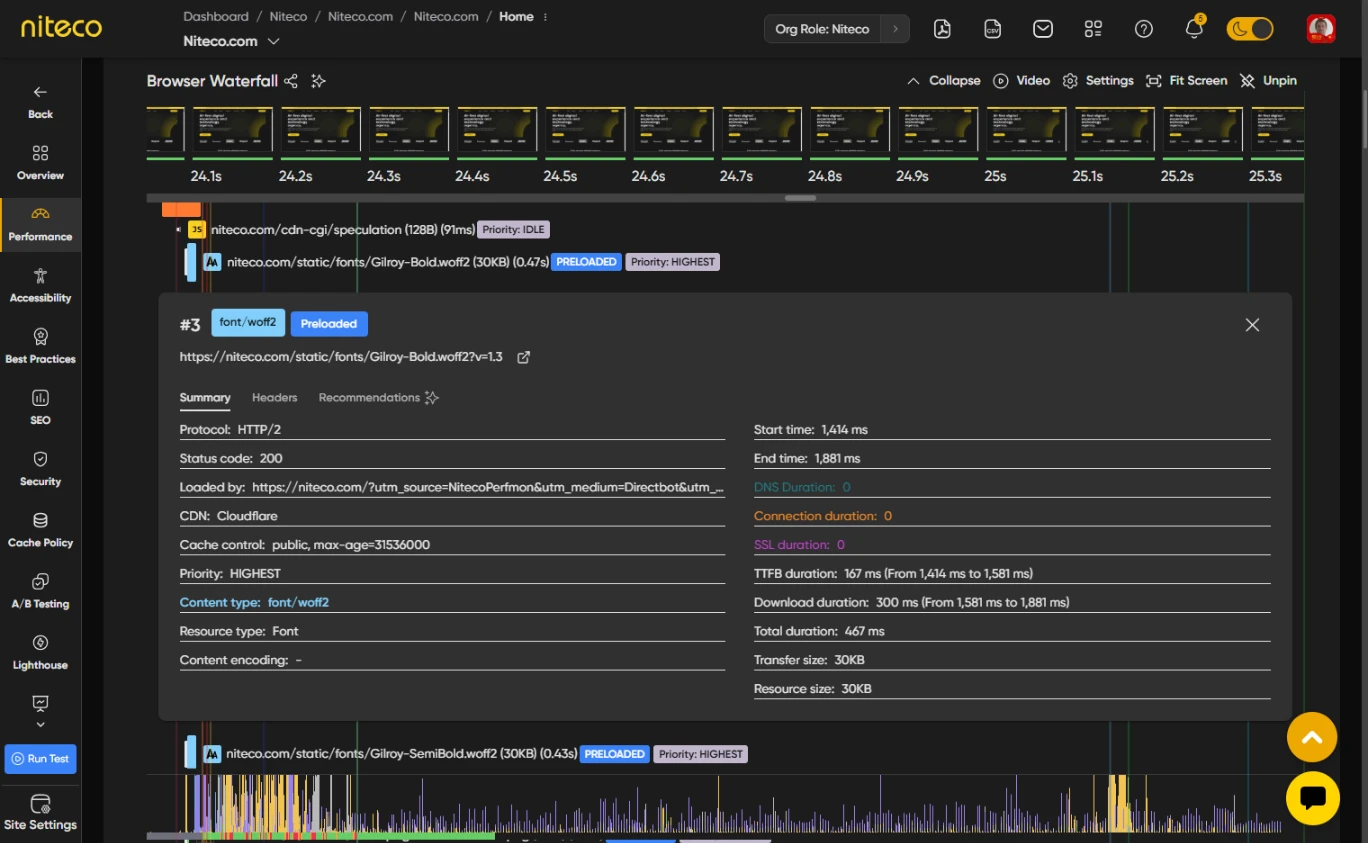
Summary – Request URL, status, timing, size, and related timings (e.g. DNS, connect, wait).
Headers – Request and response headers.
Certificate – SSL/TLS certificate details when the request uses HTTPS.
HTML Source – Response body when the response is HTML (when available).
Use these to see why a request is slow or failing (e.g. status code, headers, or timing breakdown).
4. Settings (Options)
Click on Settings in the toolbar to open the Options panel.
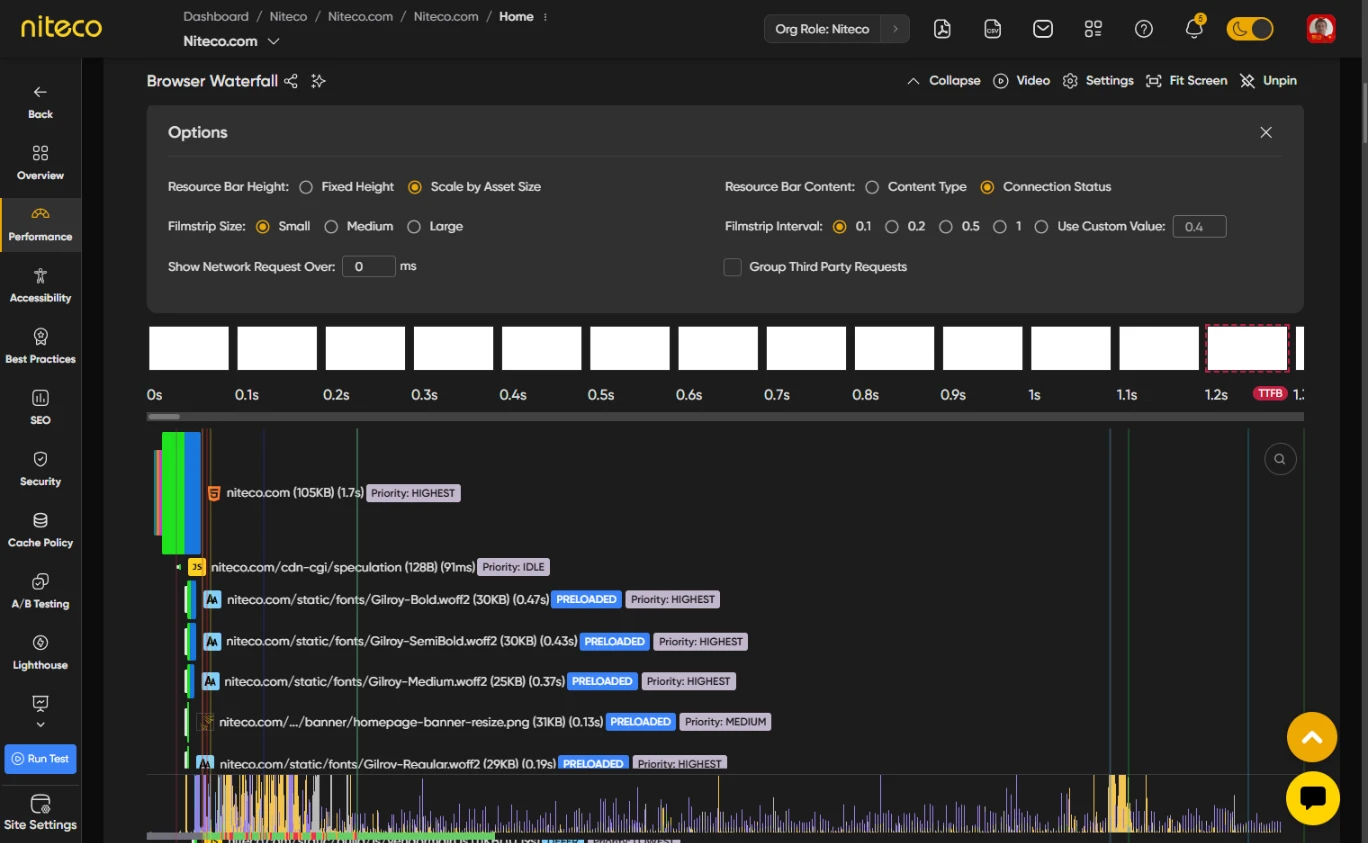
Resource bar height – Fixed (same height for all bars) or Asset size (height reflects resource size). Use asset size to spot large resources quickly.
Resource bar content – Content type (e.g. script, image, document) or Connection status (e.g. connection state over time). Use connection status to see when requests share or reuse connections.
Show network request over – Only show requests that take longer than this many milliseconds. Use this to hide very fast requests and focus on slower ones.
Group Third Party Requests – When on, requests from known third-party domains are grouped by vendor so you can collapse or expand them and see third-party impact at a glance.
Close the panel when you are done. Your choices are kept for the current report.
5. Waterfall
The waterfall shows each request as a bar, ordered by start time. When Group Third Party Requests is on (in Settings), third-party requests appear in collapsible groups by vendor. Use Resource bar height to compare sizes (fixed or by asset size) and Resource bar content to see content type or connection status on each bar.
6. Get AI Fix Suggestions
Click on Analyze Harview Requests (star icon) in the HAR view toolbar. The system runs an AI analysis of the network requests. A message such as Analyzing harview requests. This may take a moment is shown.
When it finishes, request bars that have suggestions show a recommendation badge. Click on a request bar to open the request detail panel, then open the Recommendations tab. You will see AI-generated fix suggestions for that request (for example how to optimize the resource or reduce its impact).
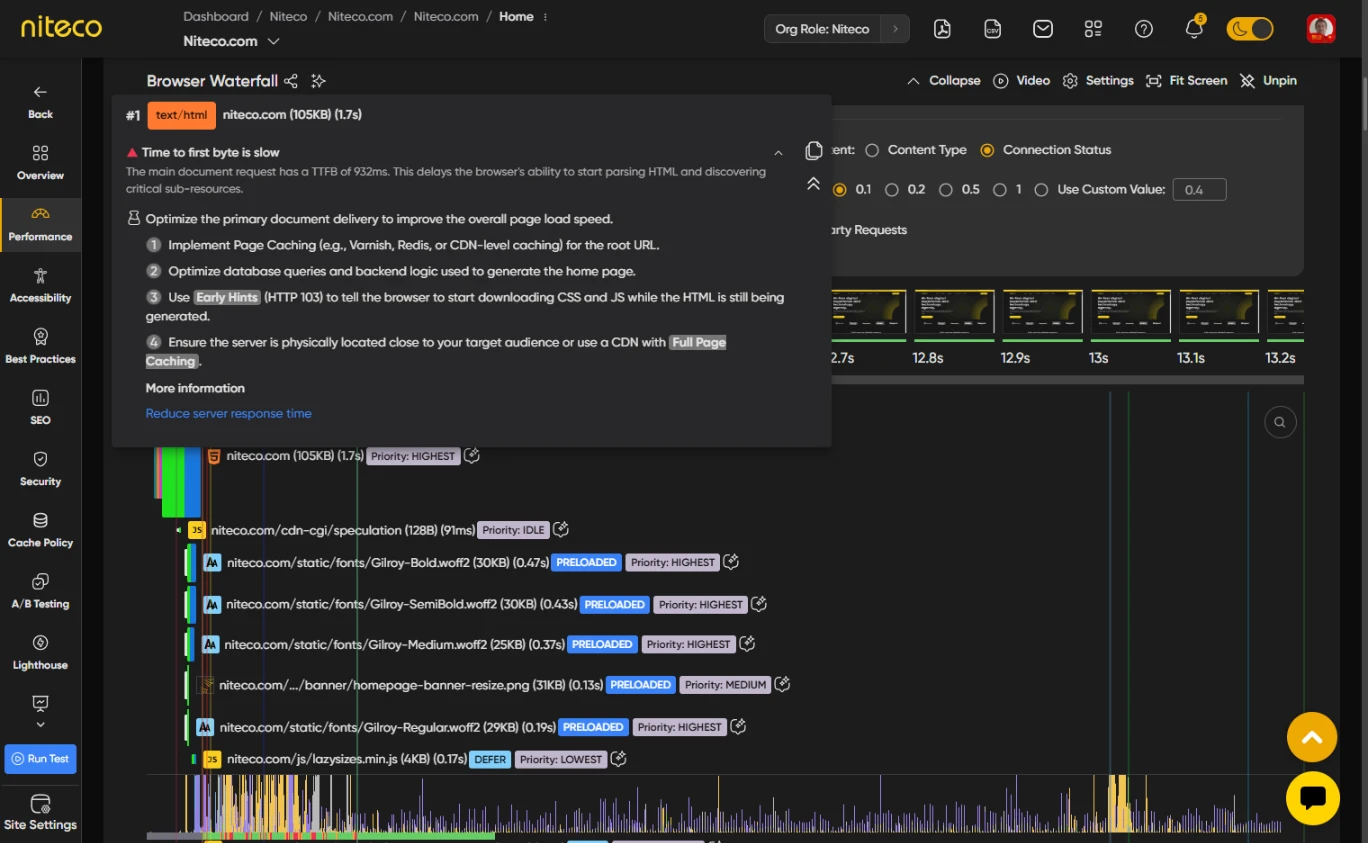
Use the suggestions to decide what to change (e.g. compress images, defer scripts, or replace a third-party call).
Updated about 1 month ago