Overview
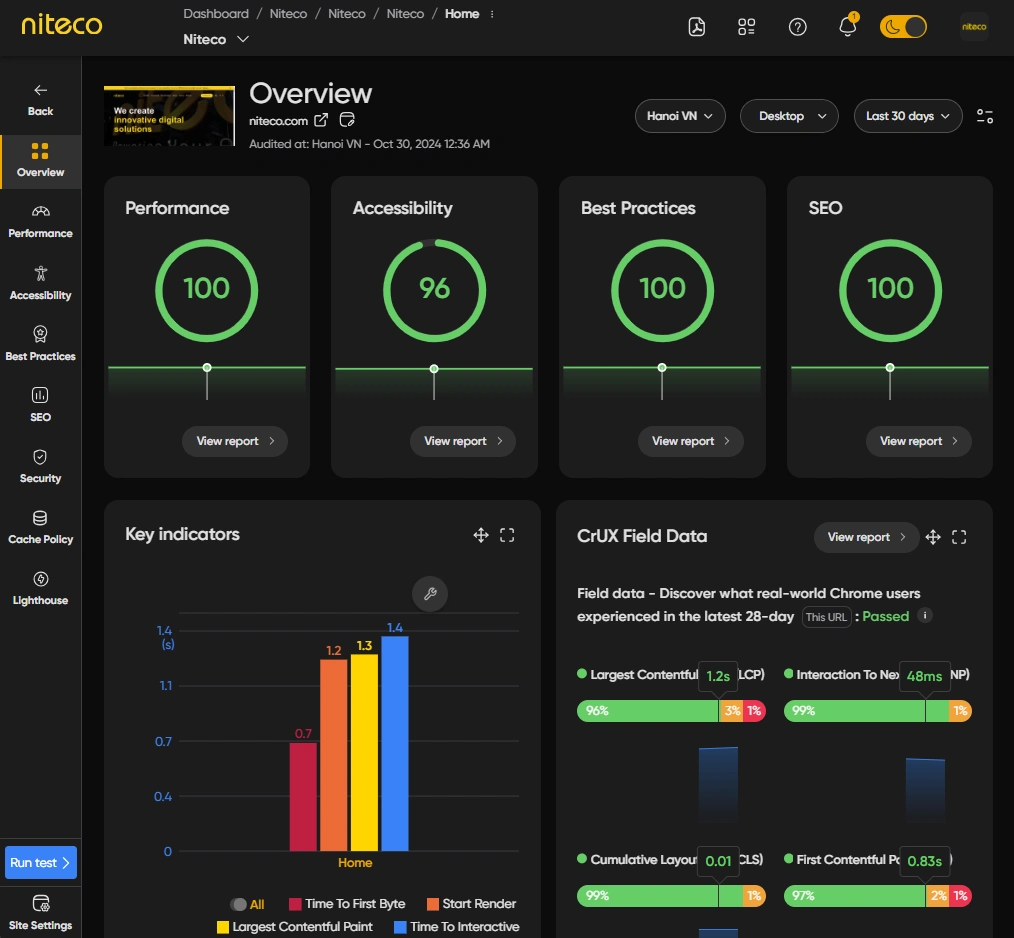
The Overview section of the Performance Report gives you a detailed look at your page’s overall health by consolidating critical metrics such as Lighthouse audits, CrUX data, comparisons with other pages on your site, and Core Web Vitals. This section provides a clear picture of how your page performs in terms of Loading Speed, user experience, and SEO effectiveness. By analyzing these metrics, you can easily identify areas where your page excels and where improvements are needed. The Overview helps you make data-driven decisions to optimize performance, enhance user satisfaction, and improve search engine visibility.
Let’s go through each section of the overview page to better understand the metrics and how they can provide valuable insights for improving your site's performance.
Lighthouse Scores

At the top of the dashboard, you’ll find Lighthouse audit results, which provide a prioritized list of actionable recommendations for improving the page’s performance, SEO, Accessability, and security. These insights offer clear, specific guidance to help you address areas needing improvement and optimize your page's overall performance.
InfoFor detailed explanations of how each of these scores are calculated read more in our Lighthouse guide.
Web Vitals
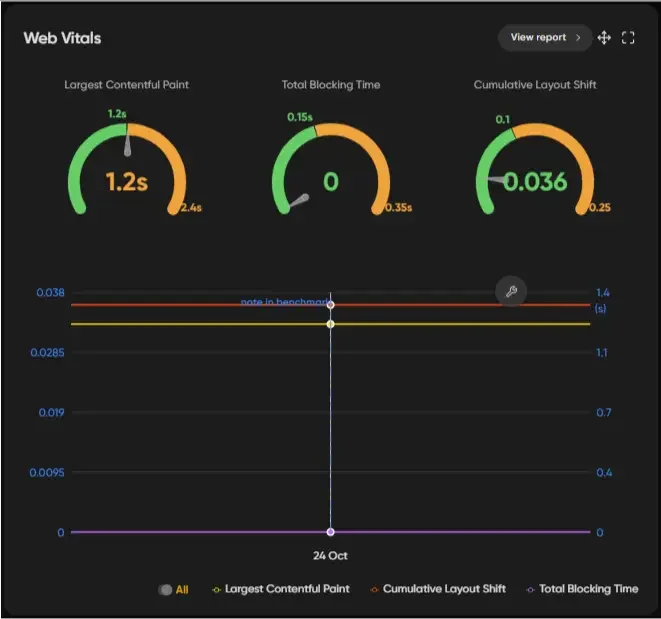
Core Web Vitals, including essential metrics like Largest Contentful Paint (LCP) , Total Blocking Time (TBT) , Cumulative Layout Shift (CLS) and Speed Index (SI). These metrics focus on the critical aspects of user experience, such as page Loading Speed, Interactivity, and Visual Stability, offering clear indicators of where performance improvements are needed.
InfoFor detailed explanations of how each of these scores are calculated read more in our Web Vitals guide.
Compared to Other Pages
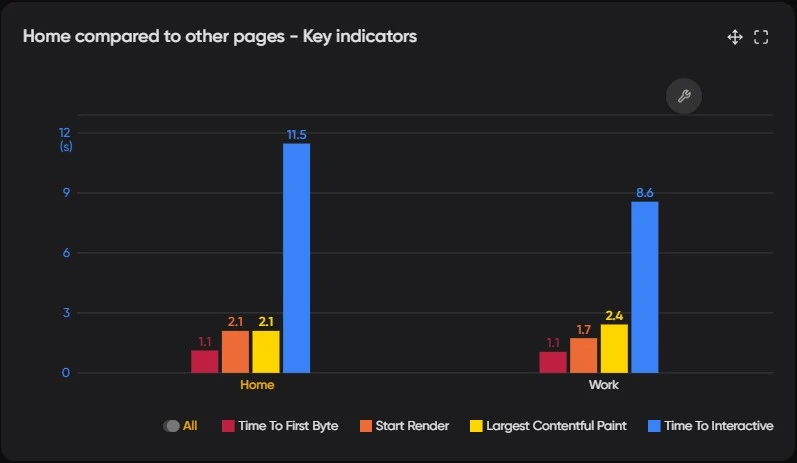
This section shows how the current page performs in comparison to other pages that were added to the Sites audit.
CrUX
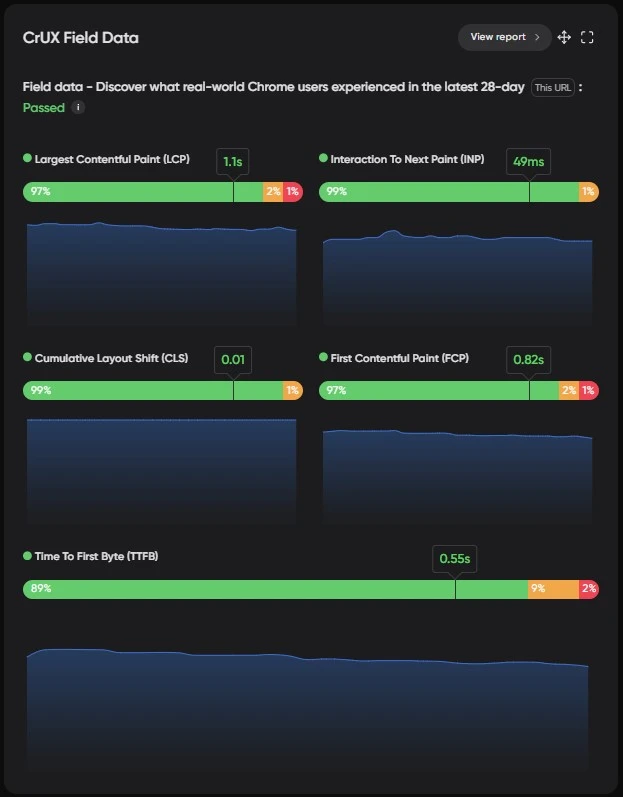
CrUX (Chrome User Experience Report) data provides real-world insights into how users experience your page based on metrics like load time, interactivity, and visual stability. This data is collected from actual Chrome users, offering a more accurate reflection of your site’s performance under real-world conditions compared to synthetic testing alone. By analyzing CrUX data, you can identify performance issues that affect real users and prioritize improvements that will have the greatest impact on user experience, helping to ensure your page delivers fast, reliable, and smooth interactions.
*Note that this data may not be available if there is Insufficient real-user data.
InfoFor detailed explanations of how each of these scores are calculated read more in Performance and Health Metrics.
Traffic
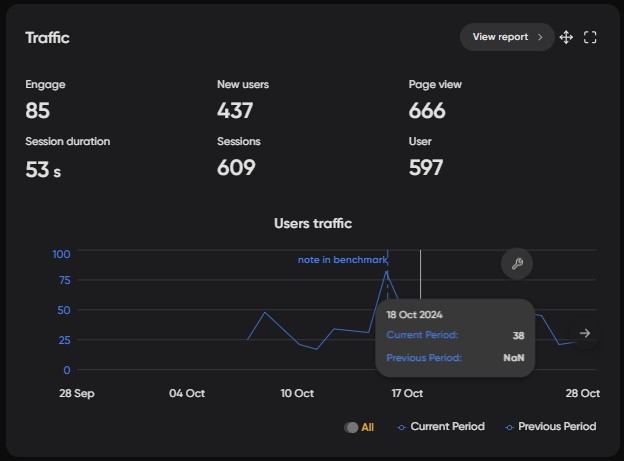
The Traffic section provides an overview of the amount and type of traffic your webpage has received over the past month. This data is derived from Google Analytics reports and is broken down into several key metrics: Engage, New Users, Page Views, Session Duration, Sessions and Users. These metrics help to understand how visitors interact with your site, the effectiveness of your content, and the overall user experience, allowing for data-driven decisions to enhance engagement and optimize performance. By comparing these metrics with past tests, you can quickly identify if a webpage has critical problems.
InfoFor detailed explanations of how each of these scores are calculated read more in Traffic.