Insights Dashboard
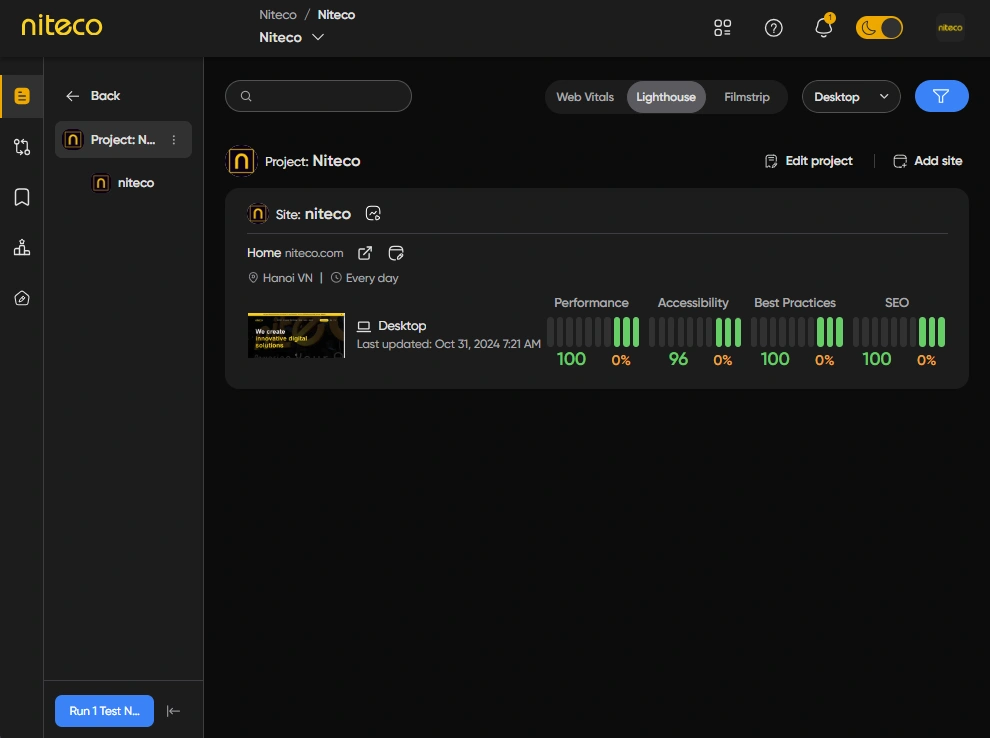
The Insights Dashboard is your main entry point in Niteco Performance Insights, giving you a high-level overview of your projects and the core performance metrics of their sites and pages. From here you can quickly diagnose potential problems across multiple projects, sites, and pages at once, add or edit projects, add sites to projects, and navigate to individual projects, sites, or pages for deeper performance and health insights.
Let's go through the available options to help you get the most out of the dashboard.
Insights Dashboard Toolbar
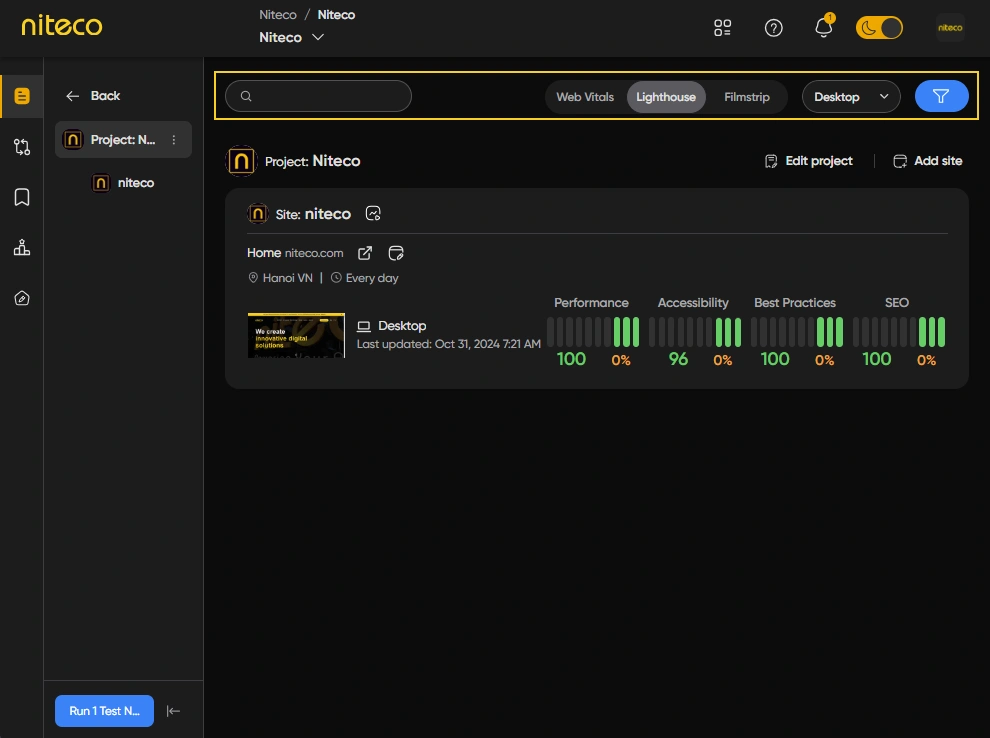
The Insights Dashboard toolbar lets you filter and refine the data displayed across the dashboard, so you can focus on the metrics and time periods most relevant to your analysis.
Let’s look at each of the sections of the toolbar and explain each of their functions:
Dashboard Views

The Insights Dashboard has three view modes, each showing a different summary of metrics for your pages. Click any of the options to switch between them.
Filter Bar
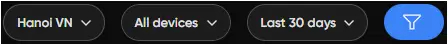
Use the Filter Menu to narrow down the data displayed in the Insights Dashboard by client, project, site, or other criteria.
Extended Filter
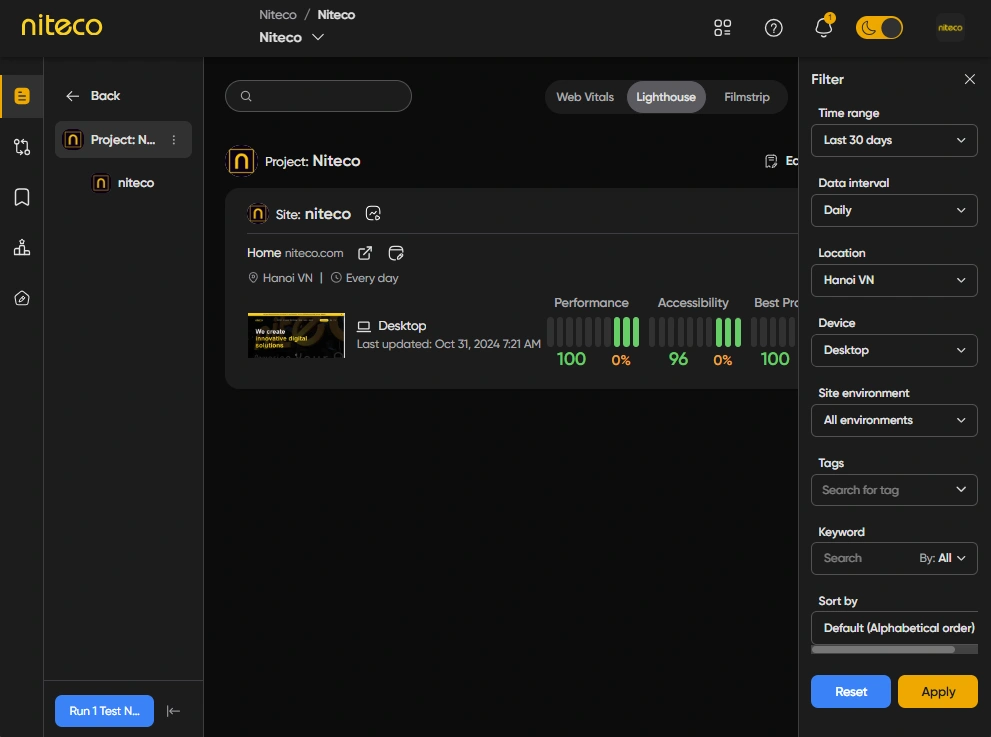
Options:
- Time range: Select the time range of the data
- Data interval: Select the frequency of data represented by each score bar
- Location: Select the location of the test result
- Device: Select the device of the test result.
- Site environment: Select your website environment (Dev, Prod, Stage, UAT, etc)
- Tags: Search pages that have some tags
- Sort by: Sort the filter results based on Lighthouse, Webvitals metrics, and Up/Down monitoring data.