In this update, we’ve made several improvements to the Uptime filter. Sites that are currently down will now always appear at the top, making it easier for you to identify issues quickly (alongside the downtime alert emails). The Uptime filter also refreshes automatically every 30 seconds, so you no longer need to manually reload the page to view updated data.
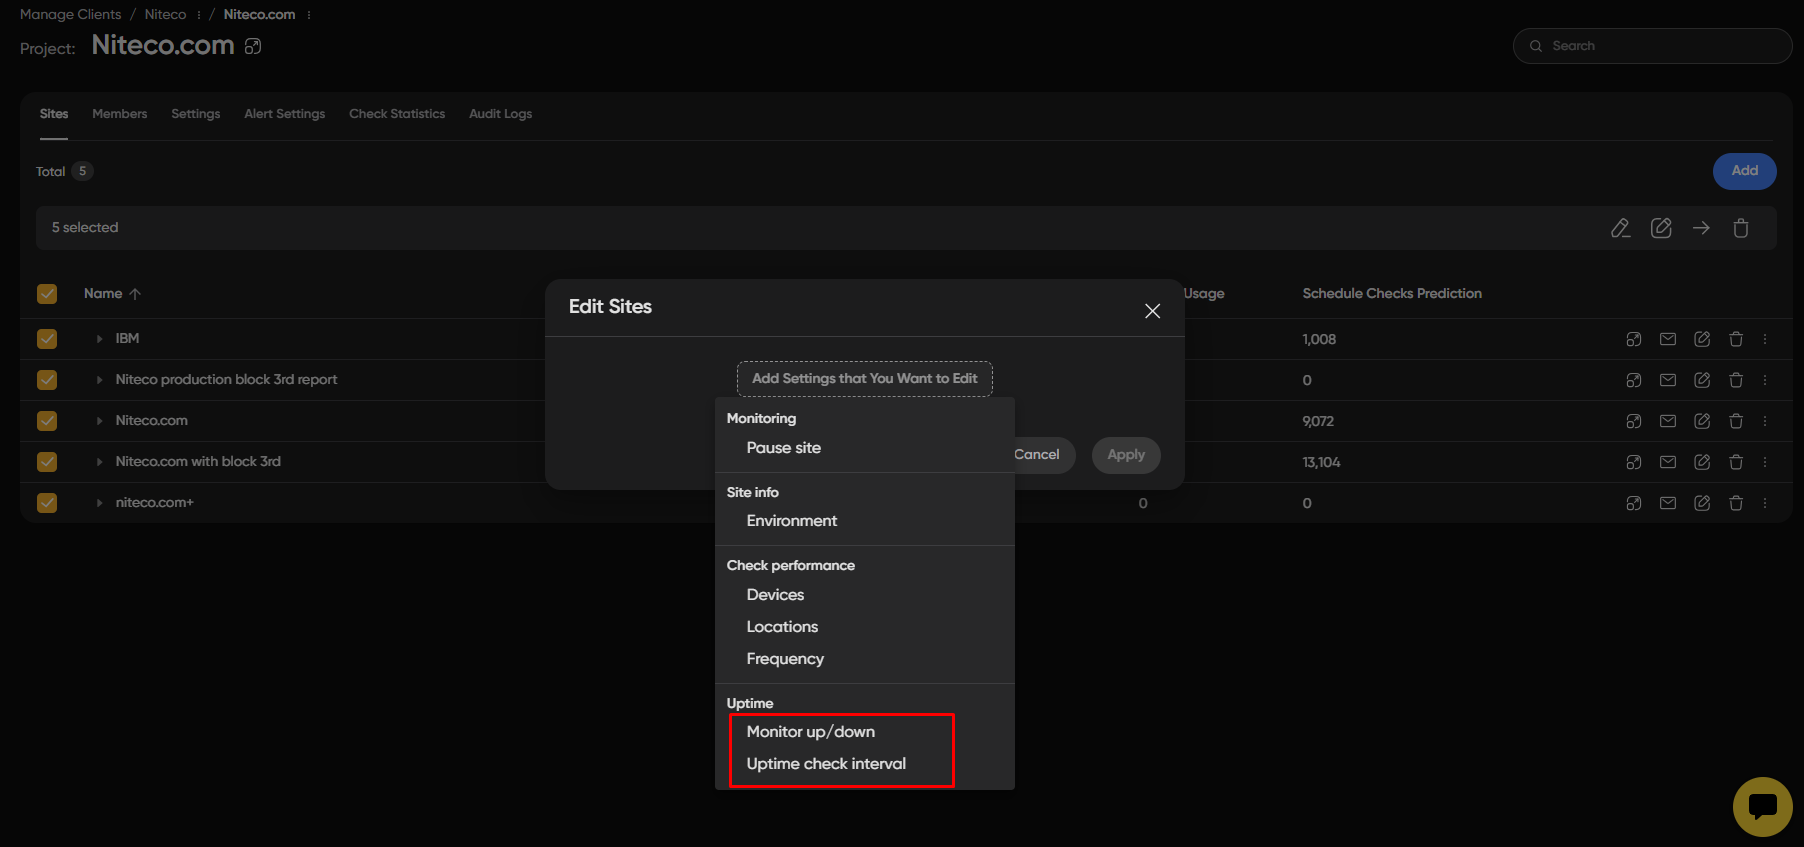
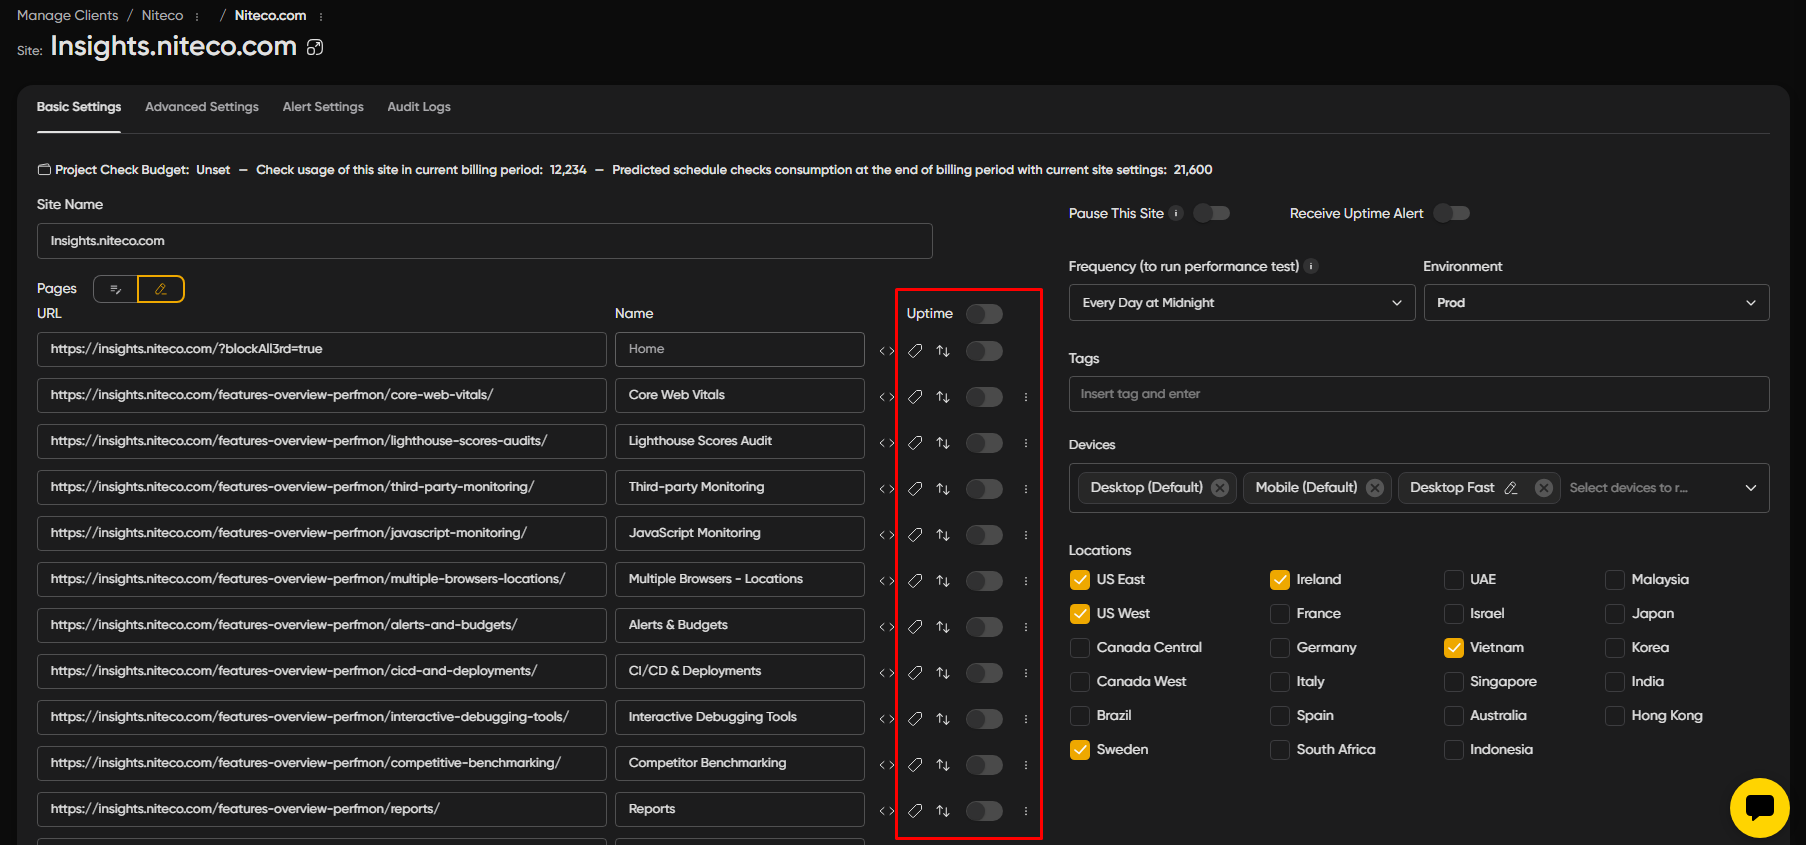
Another improvement is that you can now enable Uptime monitoring for each individual page within a site. Previously, only the first page was monitored for uptime, but now you can choose to monitor all pages or only specific ones.
Desktop Configuration Update
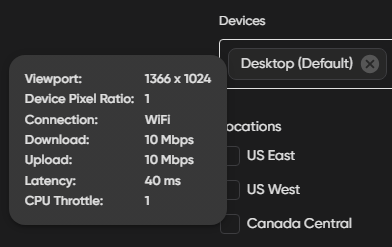
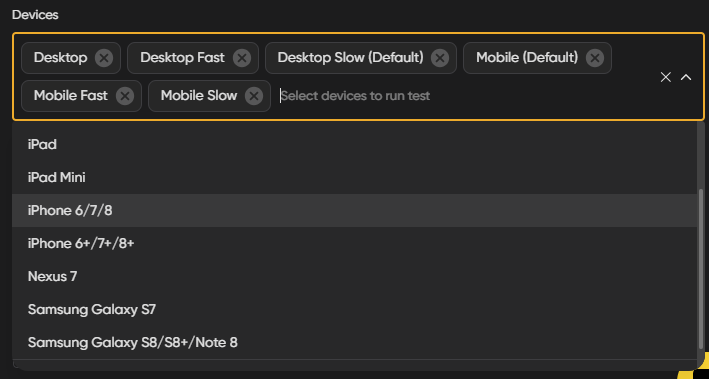
We’ve also renamed Desktop Slow to Desktop and updated its device configuration, as shown in the image.
The previous Desktop configuration has been removed since it was duplicated by the new one. For sites that previously ran tests using the removed Desktop configuration, don’t worry—your test data has not been lost. We have merged all data into the default Desktop configuration, so your full test history remains intact.
Please note that with these device configuration changes, your Lighthouse performance metrics (Performance, Accessibility, Best Practices, and SEO) will remain unaffected, while your Web Vitals metrics may improve slightly for upcoming tests.
We’ve added a new Uptime Filter to the Dashboard!
Now you can quickly focus on all sites that have uptime monitoring enabled — no more endless scrolling to find them. This gives you a clearer and more organized view of your monitored sites at a glance.
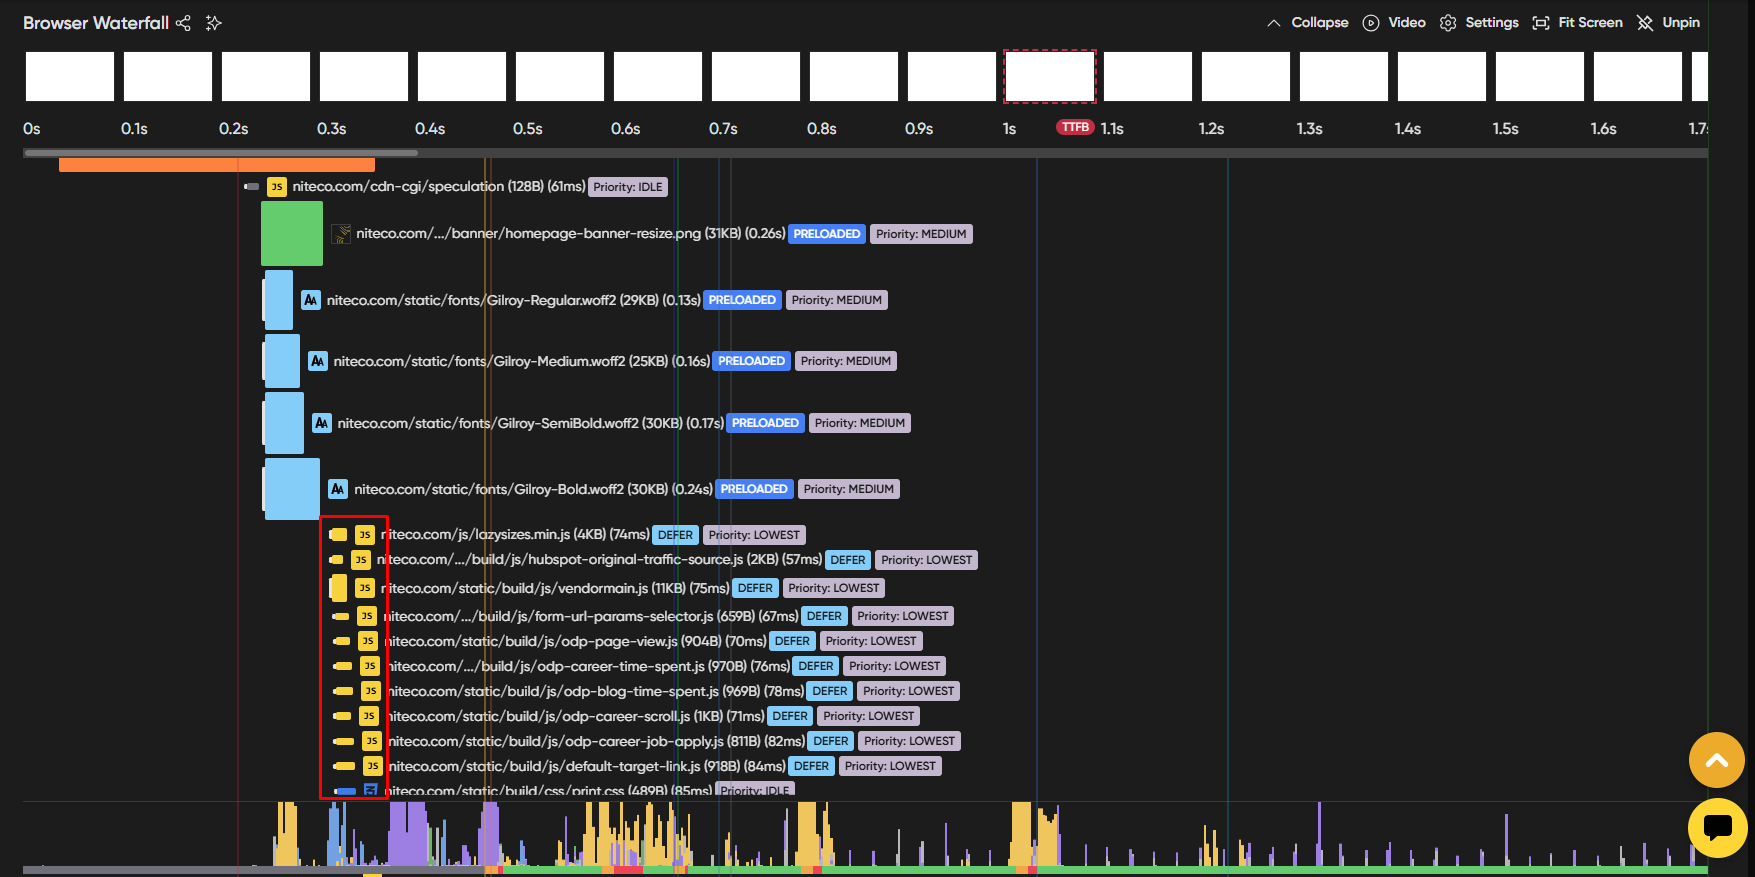
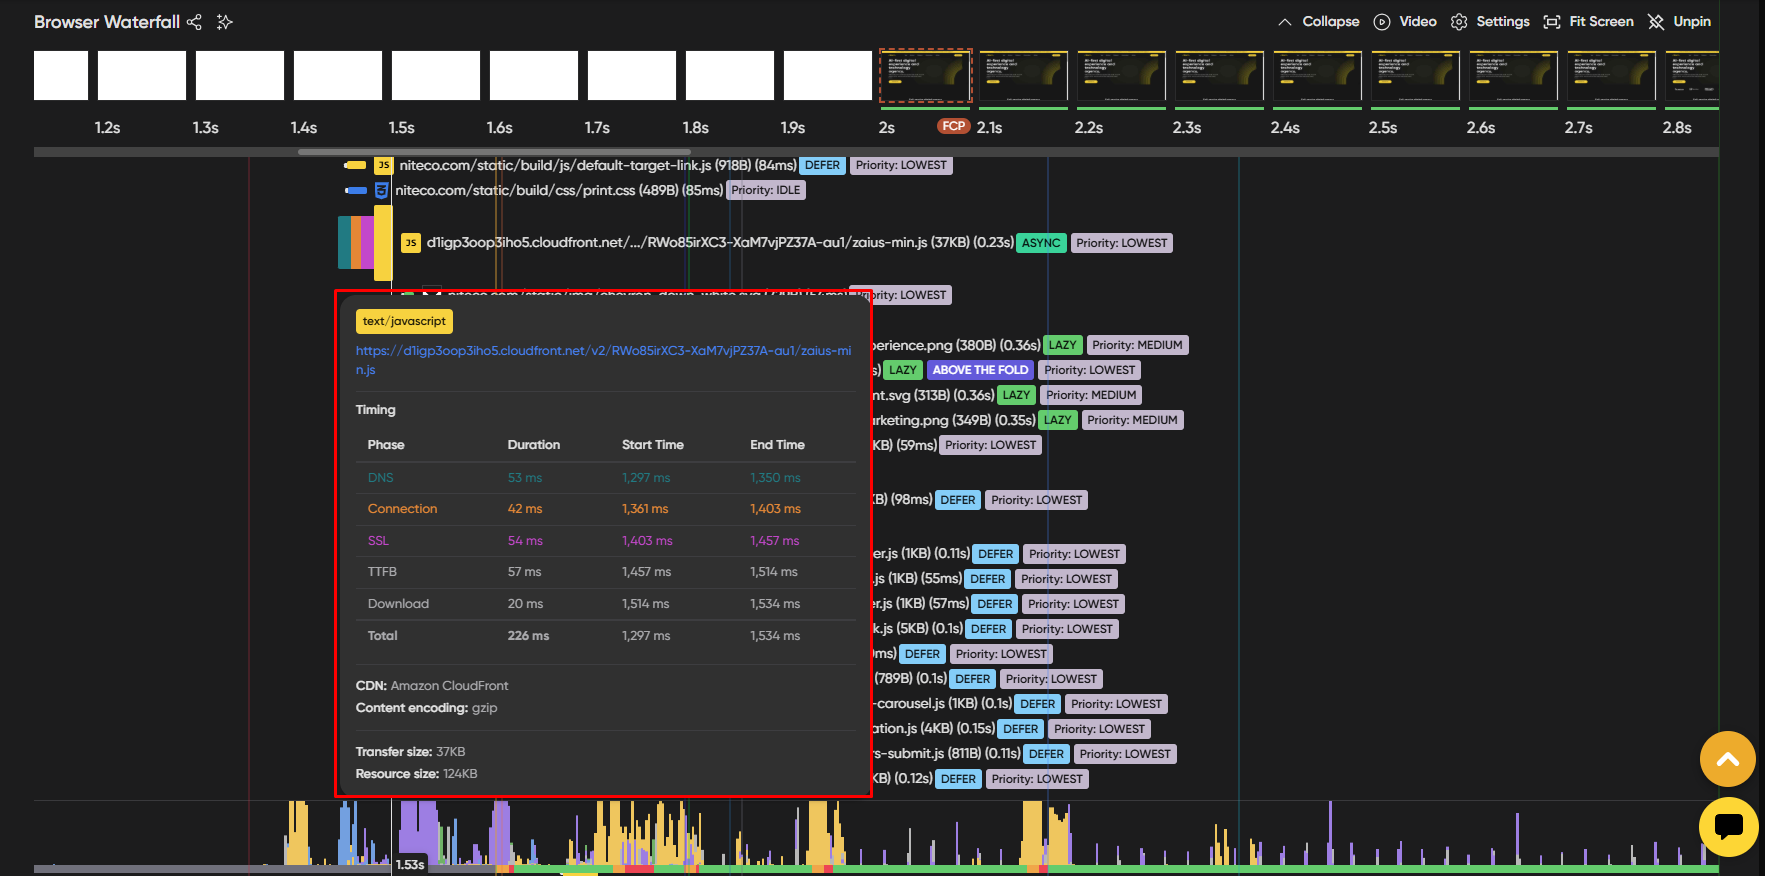
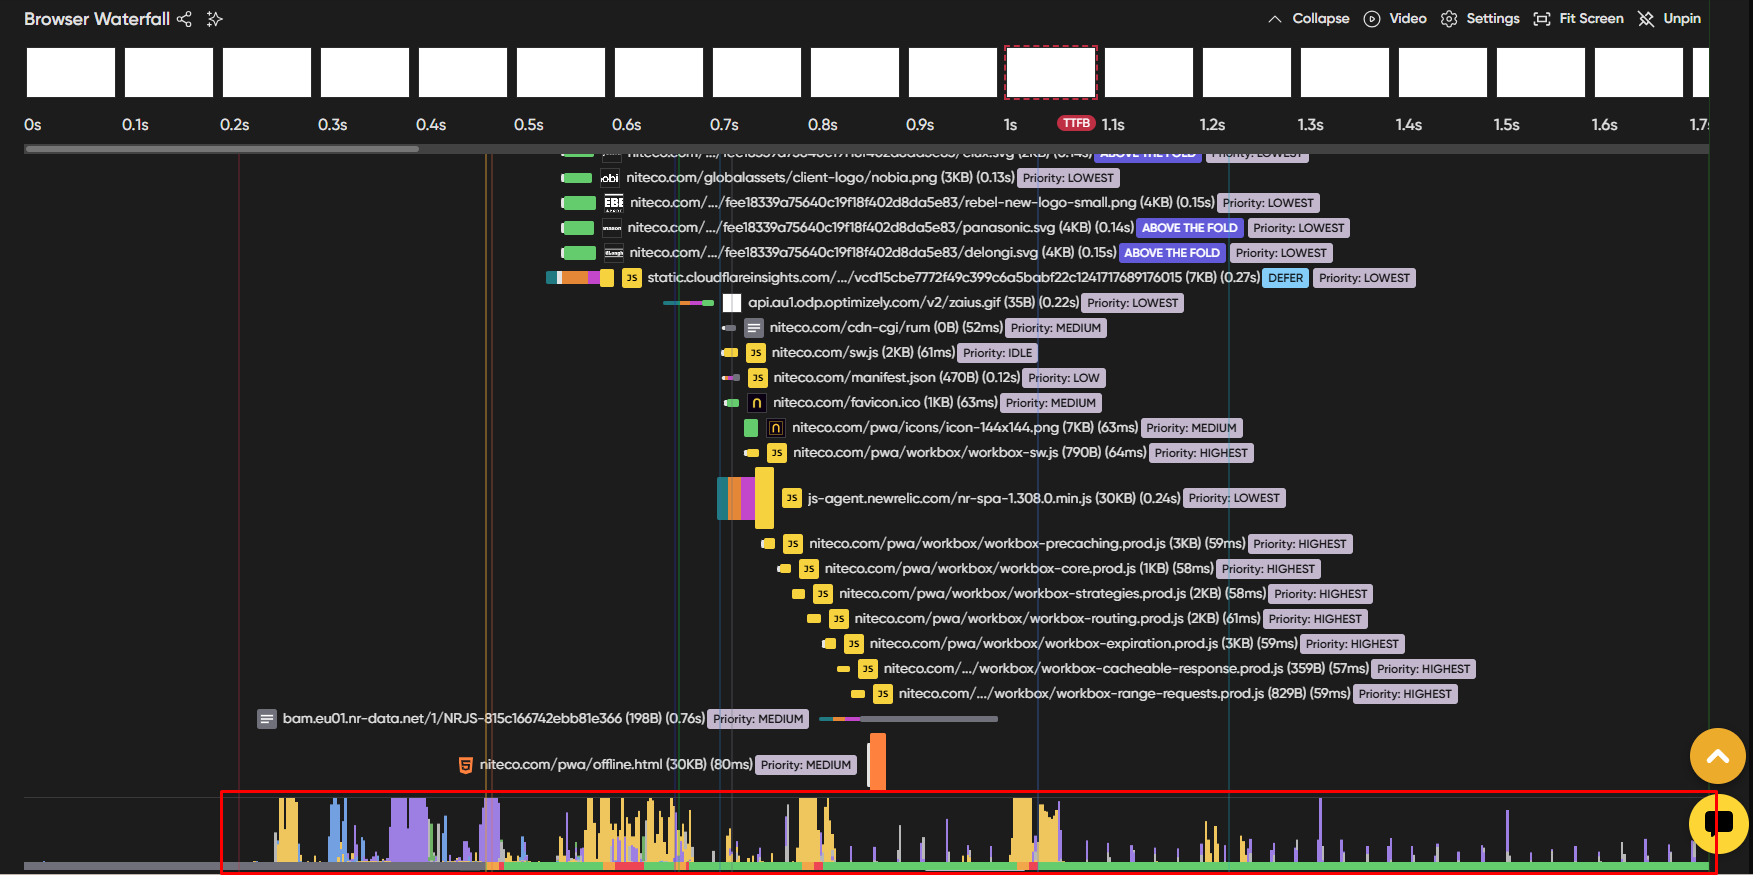
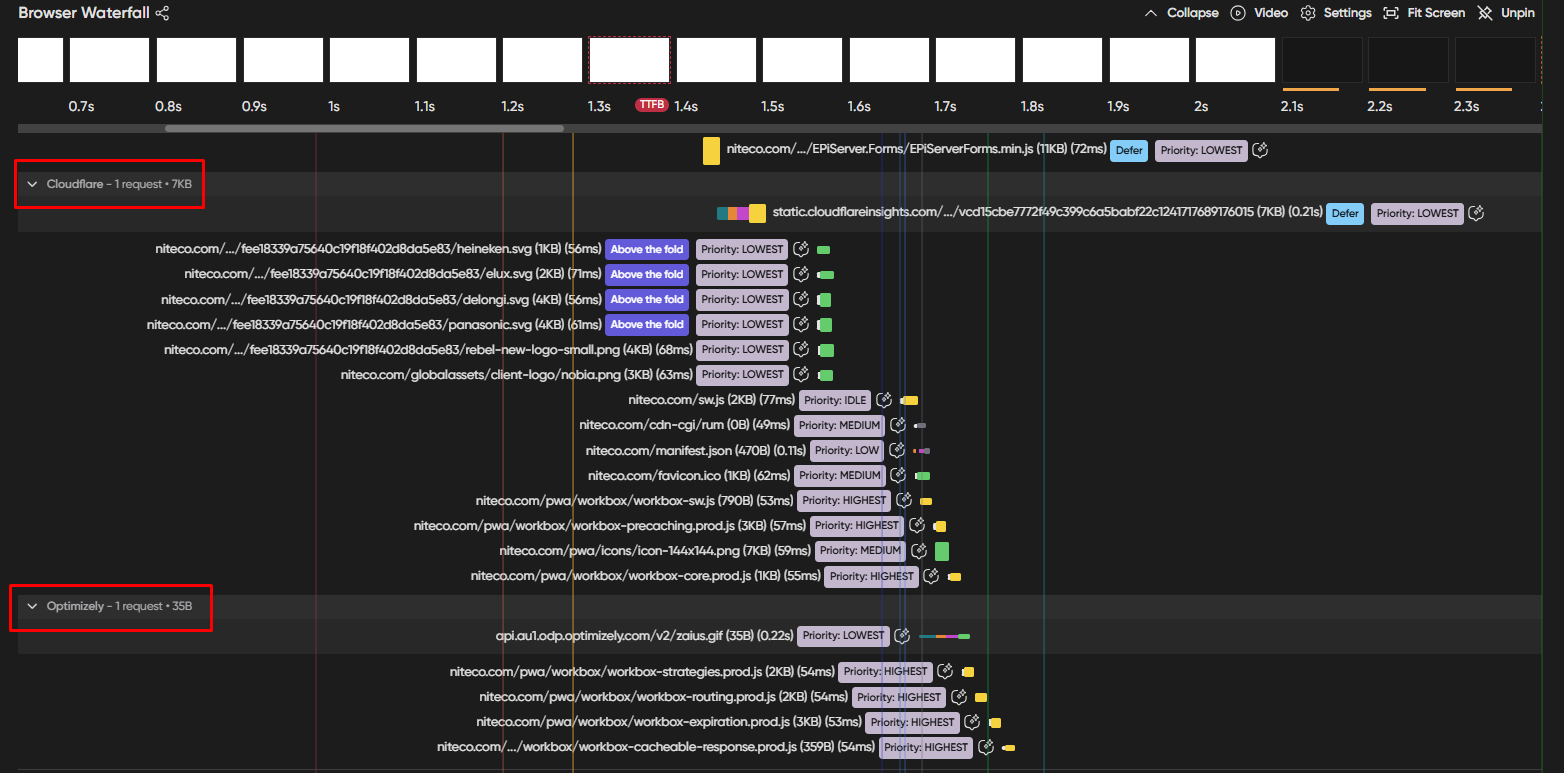
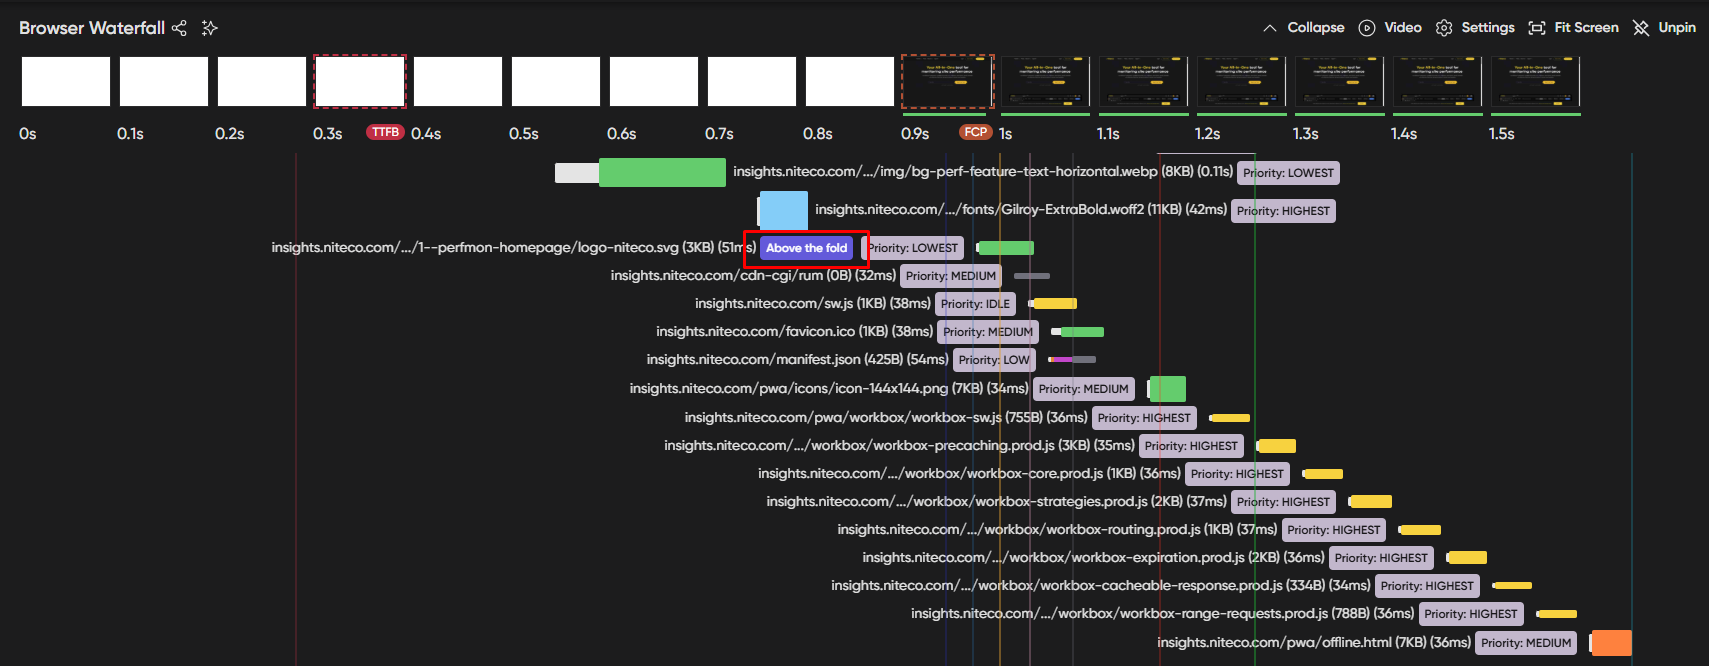
“Above the Fold” Tag in Browser Waterfall
Resources that load above the fold are now automatically tagged in the Browser Waterfall view.
This helps you easily identify critical assets that affect the first visible part of the page, so you can optimize them to improve the user’s initial loading experience.
Heads up: You’ll see this tag only in test results from October 16, 2025 and later.
In this update, we've added a new feature that alerts users when an SSL certificate is about to expire. This allows timely renewal to prevent service interruptions, security warnings, or potential vulnerabilities.
We've also introduced a feature that detects mismatches between the site's environment settings and its robots.txt configuration.
If the site is set to a production environment, robots.txt should allow crawling so search engines can index the content.
Conversely, if the site is in a non-production environment (e.g., UAT, staging, development), robots.txt should be set to disallow crawling to prevent test content from being indexed by search engines.
To receive these alerts, users can subscribe at the client, project, or site level in Alert Settings tab. See how to subscribe to alerts here
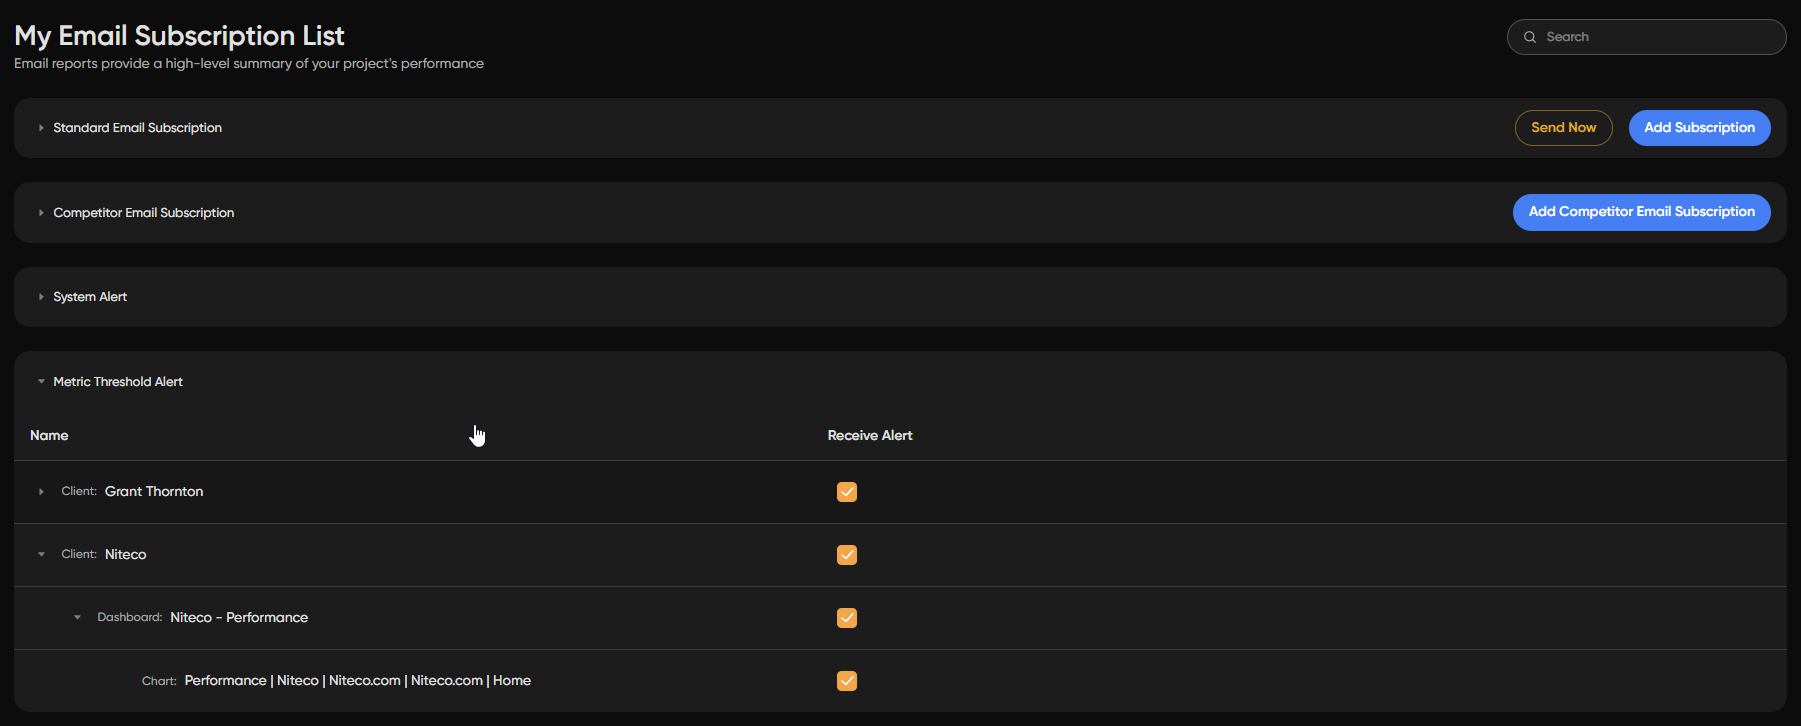
To unsubscribe from this specific type of alert, go to My Email Subscriptions or click on the Manage Subscription link of the email you received and uncheck the Web Config option
In this update, we’ve added more device options for users to quickly select from the dropdown list:
Desktop Fast
Desktop
Mobile Fast
Mobile Slow
Users can view detailed information such as viewport, connection, latency, and bandwidth of each device by hovering over the device name in the list.
The default value for "Desktop" has not changed but has been renamed to "Desktop Slow" for better clarity.
New Feature: Cookie Scanning & Auto setCookie Scripting
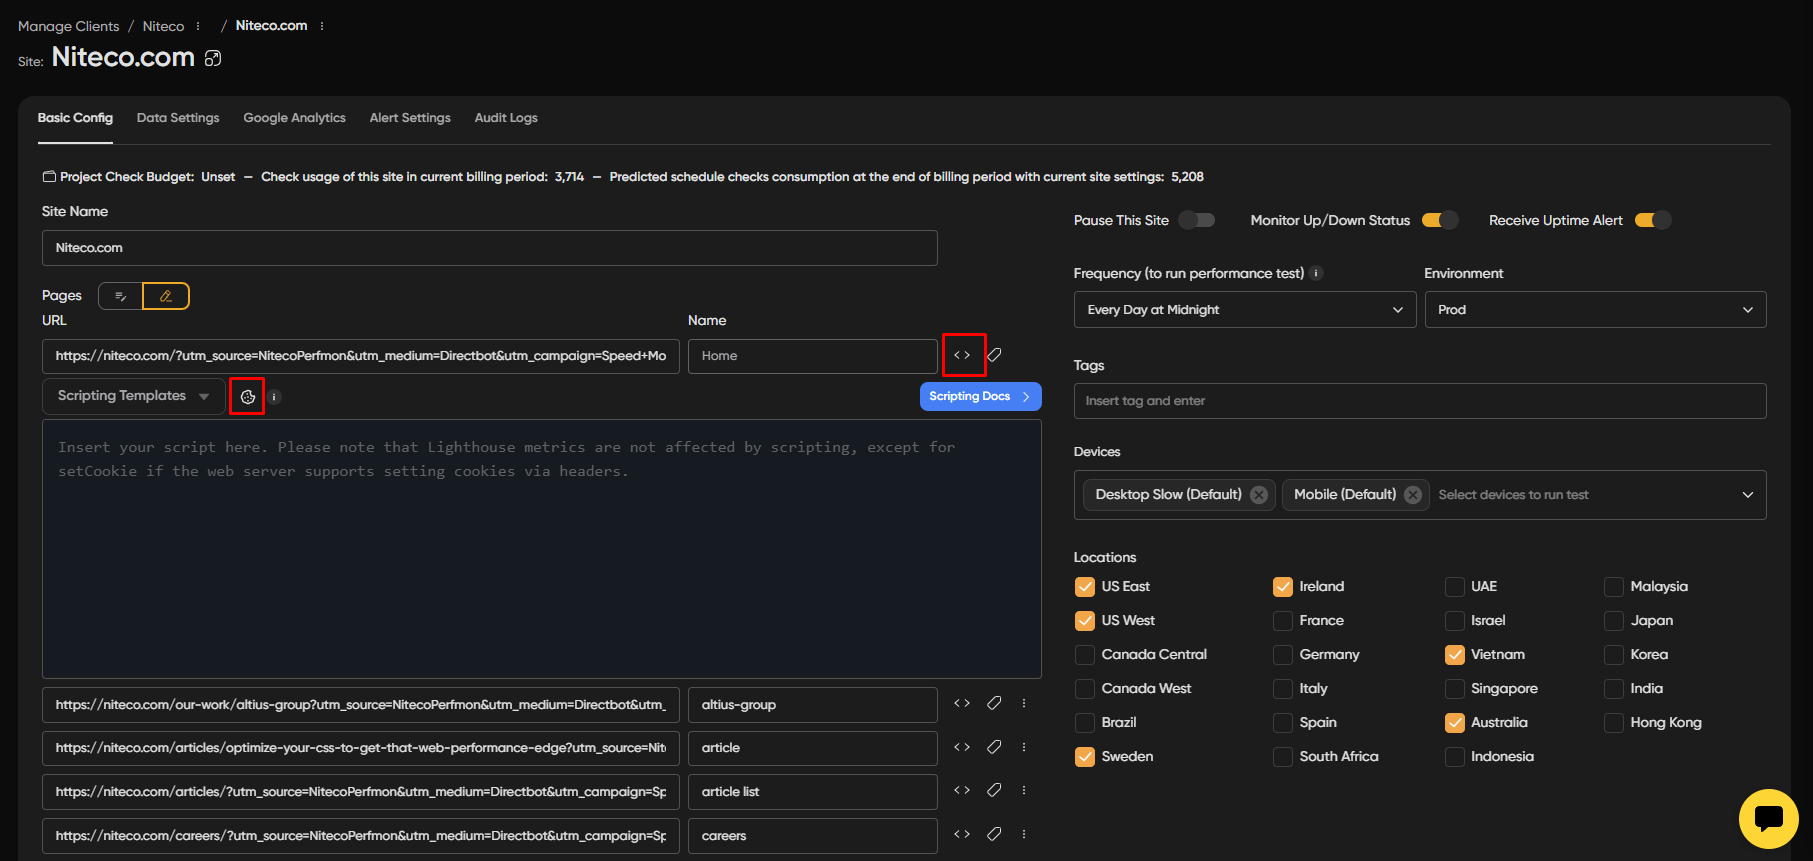
We’re introducing a new feature that allows you to scan cookies and automatically addsetCookie scripts to your site scripting.
To scan cookies: When adding or editing a site, click the Scripting icon. Then, click the Cookie icon to start scanning
Please note that Cookie consent scripting may not work as expected due to changes made by providers. For issues with supported cookies, please contact: [email protected]
Supported Cookie Providers
The system currently supports the following cookie providers:
OneTrust
Cookiebot
Didomi
CookieYes
CookieLawInfo
CookieFirst
Osano
Sourcepoint
Tealium
CookieScript
Cookie Information
CookieReports
BigID
PiwikPro
TrustArc
Ketch
Other Improvements
Overview Screen Improvement
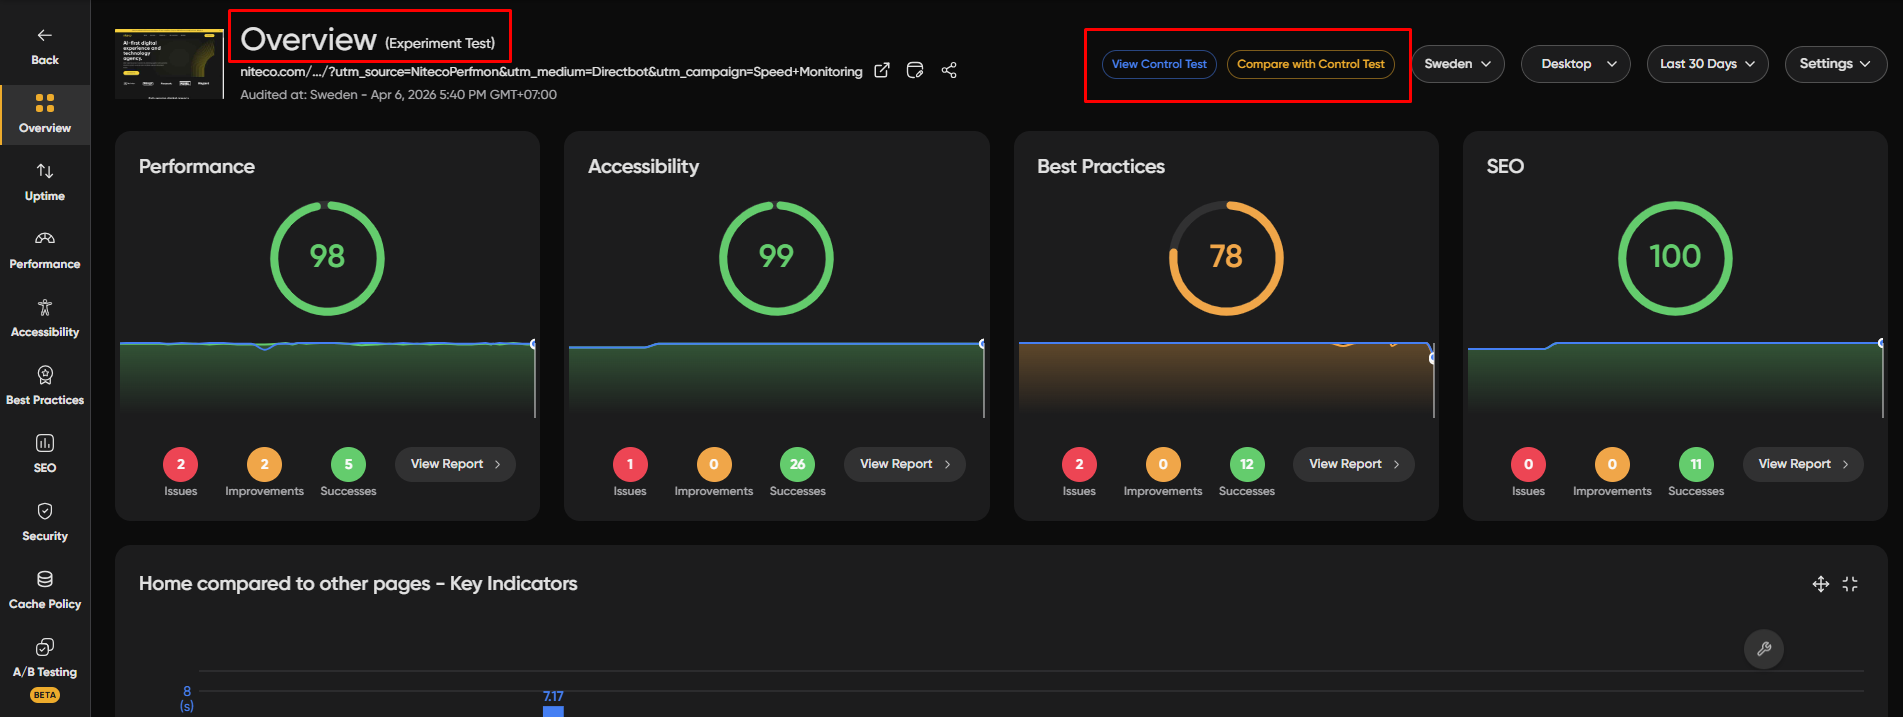
We've added the total number of issues for Performance, Accessibility, Best Practices, and SEO, allowing users to quickly see how many issues are present at a glance.
Unsubscribe to Metric Threshold Alert
Users can now manage Metric Threshold Alerts from the "My Email Subscriptions" screen, the "Alert Settings" tab at the Client, or by using the unsubscribe link in alert emails.
Our tool now offers a seamless Single Sign-On (SSO) experience, allowing users to access their accounts quickly and securely using their existing credentials from trusted third-party providers. We currently support logins via Microsoft, Google, GitHub, and LinkedIn.
This feature eliminates the need to remember yet another password and ensures a smoother, more efficient login process — especially for users who regularly work across multiple platforms.
If your registered email address does not match any of the supported external accounts, you can still take full advantage of SSO by linking your account manually. To do this:
Log in to the system and click on your profile icon in the top-right corner of the screen.
Select User Information from the dropdown menu.
Under the Advanced Information section, connect your account to one or more available SSO providers.
Once linked, you’ll be able to sign in with those services directly on future visits — saving time while maintaining security.
Whether you’re an individual user or part of a larger team, SSO helps simplify access management and enhances the overall user experience.
We’ve introduced several improvements to make tracking website performance and managing alerts more intuitive and efficient.
Custom Dashboard Enhancements
The Custom Dashboard now offers more flexibility for tracking Web Vitals, Lighthouse scores, and other metrics, allowing users to monitor trends and receive alerts on performance fluctuations.
Sticky Chart Preview: The chart preview remains visible so users can instantly see changes when modifying metrics.
Improved Layout: We’ve reorganized components to simplify the process of creating and editing charts.
Updated Left Menu: Users managing multiple clients can now quickly locate their dashboards.
Email Alert Subscription Enhancements
Managing alert subscriptions is now easier, ensuring you receive only the notifications that matter.
Subscribe/Unsubscribe to Alerts: Users can now manage uptime alerts and failed test alerts.
Flexible Management Options: Update your email subscriptions from the My Email Subscription screen or the Alert Settings tab from Client/Project/Site level or the unsubscribed link in the received email
We’ve enhanced the CrUX Field Data section on the Overview and Performance screens by adding LCP Subparts and RTT (Round Trip Time) metrics. These additions provide more insights into your site’s real-user performance and help you prioritize the right areas for optimization.
LCP Subparts
This new feature breaks down the Largest Contentful Paint (LCP) element into its components such as Time to First Byte (TTFB), Resource Load Delay, Resource Load Duration, and Element Render Delay. These metrics help pinpoint which part of the LCP contributes most to the delay, allowing you to optimize your page’s loading performance more effectively.
To view the details, click the "View LCP Subparts" button in the CrUX Field Data section on the Overview or Performance screen
RTT (Round Trip Time)
RTT measures the time it takes for a network request to travel from the browser to the server and back. High RTT can indicate network latency issues that impact your site’s speed, especially for users in certain regions.
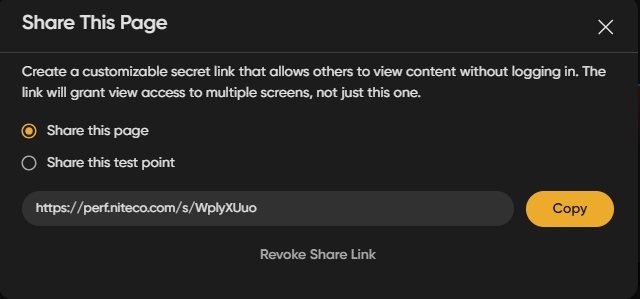
We are pleased to announce that users can now share viewer access to their projects, site or even their whole client using customized and revokable secret links.
New Payment Methods Added
A variety of new payment options have been added, such as debit/credit card and digital payment methods, to provide greater flexibility and convenience at checkout.