Performance
The Performance page provides a detailed analysis of your site's speed and responsiveness, featuring key metrics and insights such as Lighthouse Performance, Web Vitals, real-world CrUX data, and technical breakdowns like Browser Waterfall and content sizes. Additionally, it includes detailed lab test information, offering a snapshot of the testing environment for further analysis.
Let’s explore each section to understand how to interpret data:
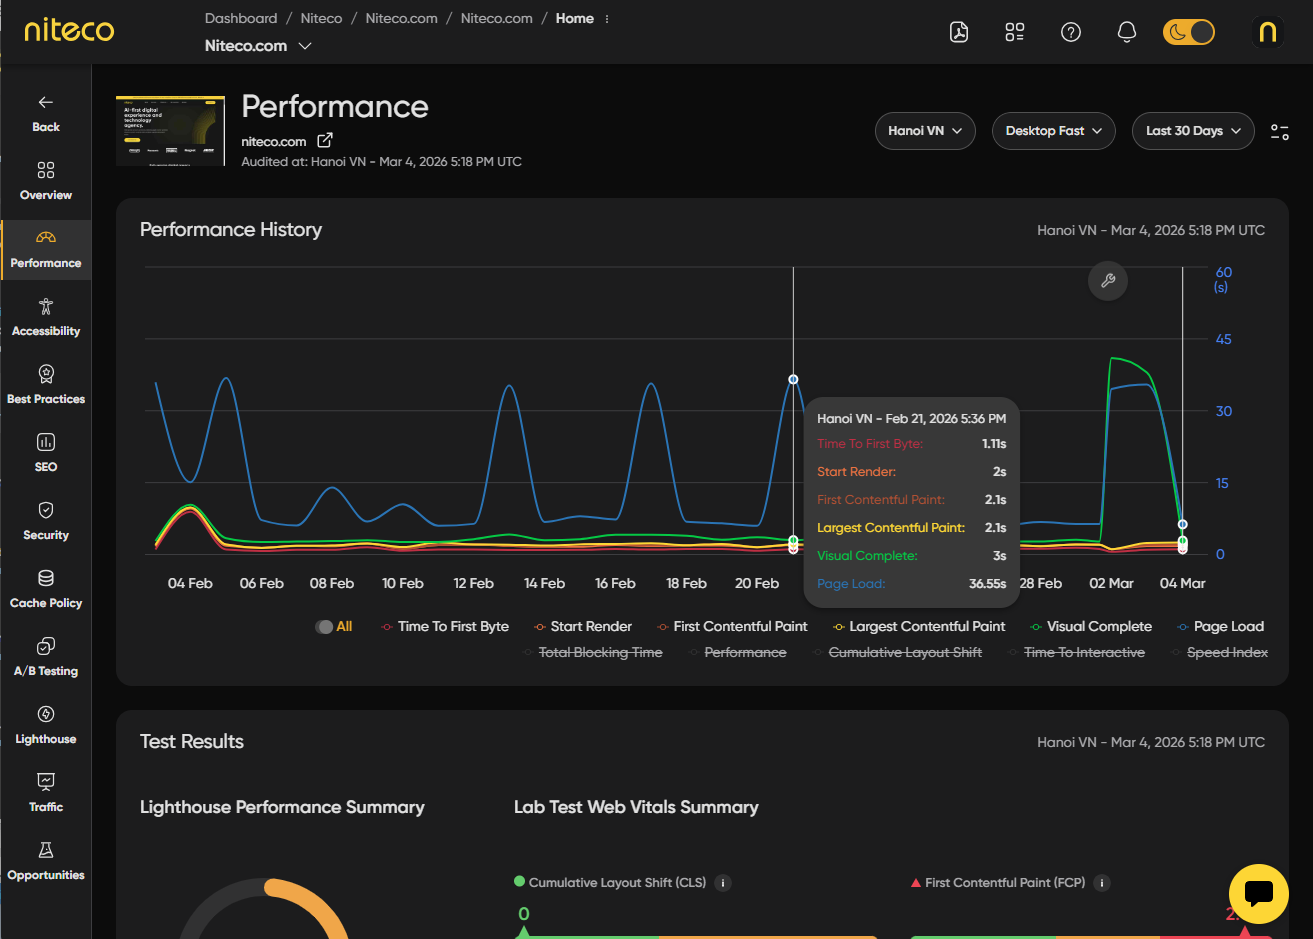
Performance History
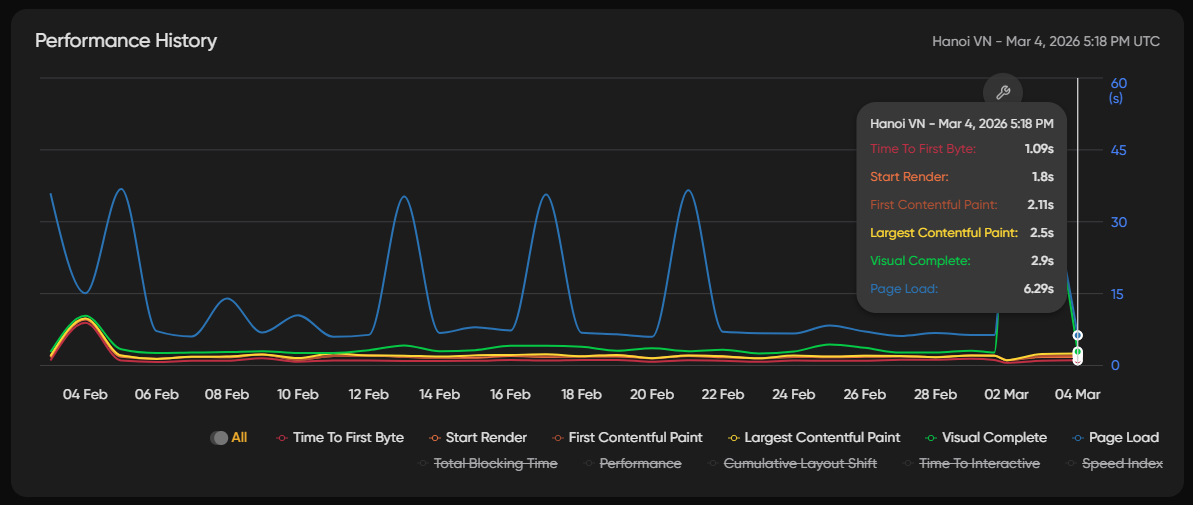
The Performance History section provides a timeline of key performance metrics to help you track how your site evolves over time. These metrics offer insights into load times and user experience, allowing you to monitor the impact of changes and optimizations:
Time to First Byte (TTFB)
Measures how long it takes for the browser to receive the first byte of data from the server.
Start Render
Tracks when the first visible content is displayed on the screen.
First Contentful Paint (FCP)
Indicates when the browser renders the first piece of meaningful content.
Largest Contentful Paint (LCP)
Measures when the largest content element is displayed in the viewport.
Visually Complete
Marks the point when all content in the viewport has finished rendering.
Page Load
Records the time when the page has fully loaded and is ready for interaction.
Total Blocking Time (TBT)
Measures the amount of time that long tasks block the main thread, preventing user interaction.
Performance
Provides an overall performance score based on various metrics and benchmarks.
Cumulative Layout Shift (CLS)
Tracks how much visible content shifts unexpectedly, impacting visual stability.
Time to Interactive (TTI)
Indicates the time it takes for the page to become fully interactive and responsive to user input.
Speed Index
Measures how quickly content is visually displayed during the page load process.
By tracking these metrics over time, you can monitor performance trends, identify bottlenecks, and ensure your site is delivering a smooth user experience.
For detailed explanations of how each of these scores are calculated read more in Performance and Health Metrics
Lighthouse and Web Vitals Summary
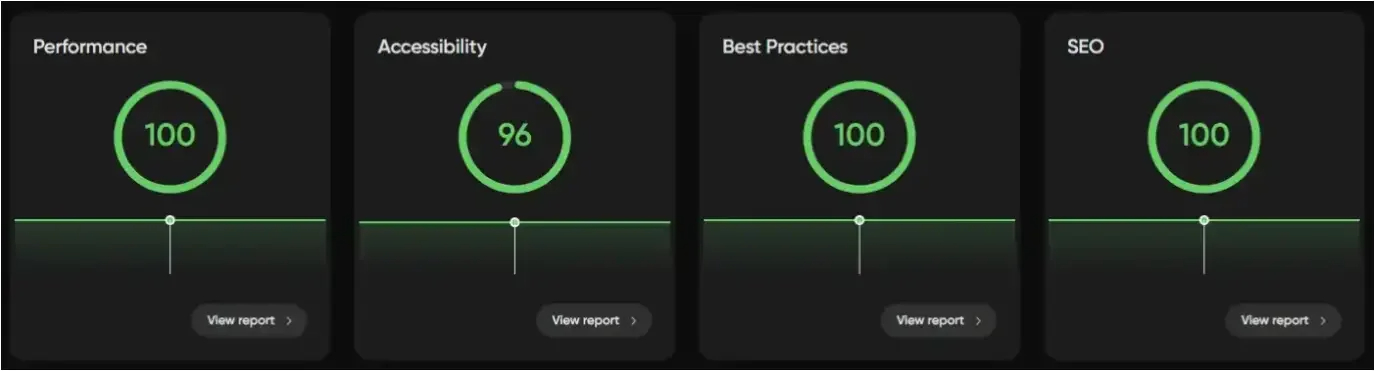
The Lighthouse and Web Vitals Summary provides an at-a-glance overview of your page’s performance, combining insights from Google's Lighthouse audits and key Web Vitals metrics. Lighthouse scores offer high level assessments across Performance, SEO, Accessability, and Best Practices, while Web Vitals focus on critical user experience metrics such as Largest Contentful Paint (LCP), First Input Delay (FID), and Cumulative Layout Shift (CLS). This summary helps you quickly identify areas for improvement and prioritize actions that will have the greatest impact on your page’s speed, user experience, and search engine visibility.
For detailed explanations of how each of these scores are calculated read more in Performance and Health Metrics.
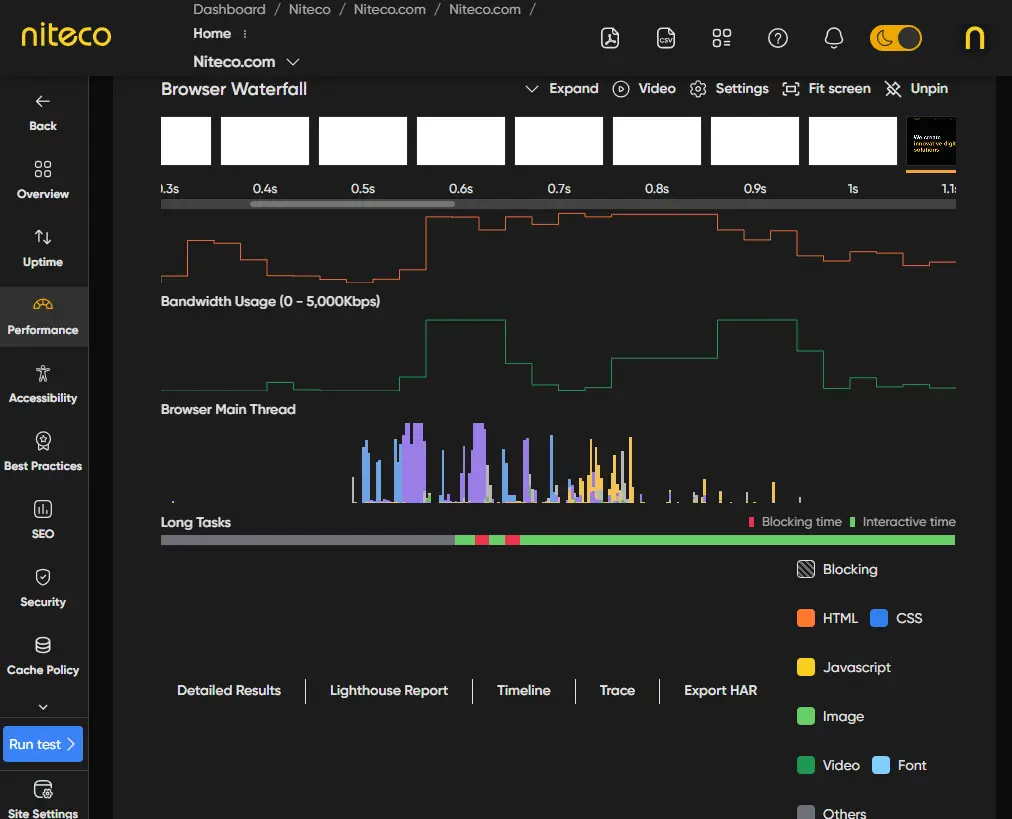
Browser Waterfall
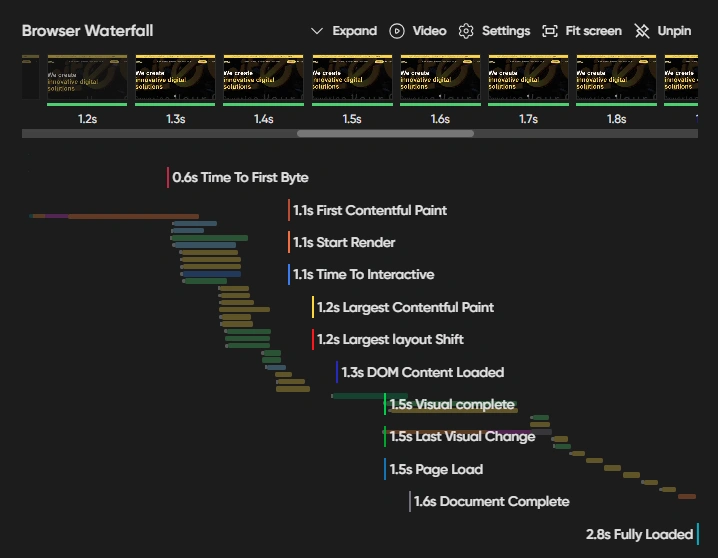
The waterfall chart is also known as the waterfall graph. It provides you with a visual representation of how all the assets on your website load. This includes CSS, JavaScript, HTML, images, plugins, and third-party content.
The Browser Waterfall measures several important metrics:
Fully Loaded
The Fully Loaded time is measured from the start of the initial navigation until there have been 5 seconds of no network activity after the DOM Complete event. This metric typically includes any additional activity triggered by JavaScript after the main content has loaded.
Visually Complete
Refers to the moment when all content in the viewport has fully rendered, and no further changes occur as the page continues to load. It’s an important user experience metric because it indicates that users can now see the full content on the screen and start engaging with your site.
Large layout shifts
Large Layout Shifts can create a frustrating experience for your visitors as they make your page appear visually jarring, as page elements appear suddenly, move around, and affect how your visitors interact with the page. Avoiding large layout shifts is essential in creating a smooth and streamlined experience for your visitors.
CPU Utilization
Measures the percentage of time the CPU is actively processing tasks. High CPU utilization can indicate performance bottlenecks where the page’s rendering or JavaScript execution is demanding too many resources.
Bandwidth Usage
Refers to the total amount of data transferred between the server and the browser during page load. Higher bandwidth usage can slow down page loading, especially for users on slower connections.
Browser Main Thread
Handles crucial tasks like parsing HTML, CSS, and JavaScript to render the page. If the main thread is overloaded, it can delay the rendering of visible content and affect the page's interactivity, leading to a slower user experience.
Long Tasks
Identifies operations, such as large JavaScript executions, that run for an extended period and block the main thread. Long tasks can cause UI responsiveness issues, leading to lag or "jank" in user interactions.
Learn more about the Browser Waterfall in Performance and Health Metrics.
Browser Waterfall Settings

Click on the settings button above the Browser WAterfall to to open the HAR view settings.
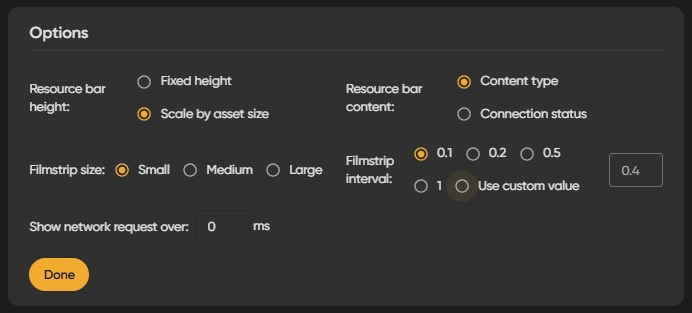
The Browser Waterfall settings offer advanced controls that help you analyze how your page loads and renders for users. These settings allow you to gain deeper insights into specific elements like images and videos, customize the way the waterfall is displayed, and manage the filmstrip’s layout. Below are explanations of each setting and how they enhance your understanding of the page loading process.
Expand
The expanded mode allows you to view how long an image or video takes to render fully, providing detailed timing information for each media element.
Video
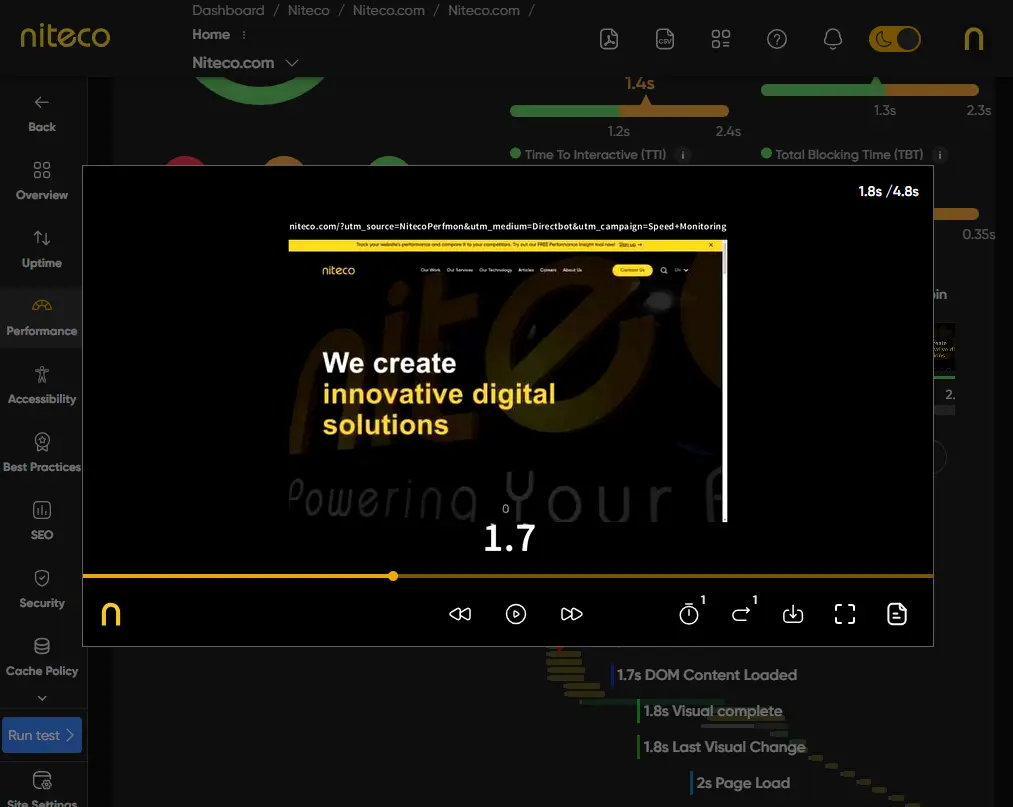
The video setting shows a recorded playback of how users experience the page rendering, offering a visual representation of load times and user interaction points.
Pin/Unpin
Pinning the filmstrip locks it in place, keeping it fixed on the screen, while unpinning allows you to move or reposition it as needed.
CrUX Data
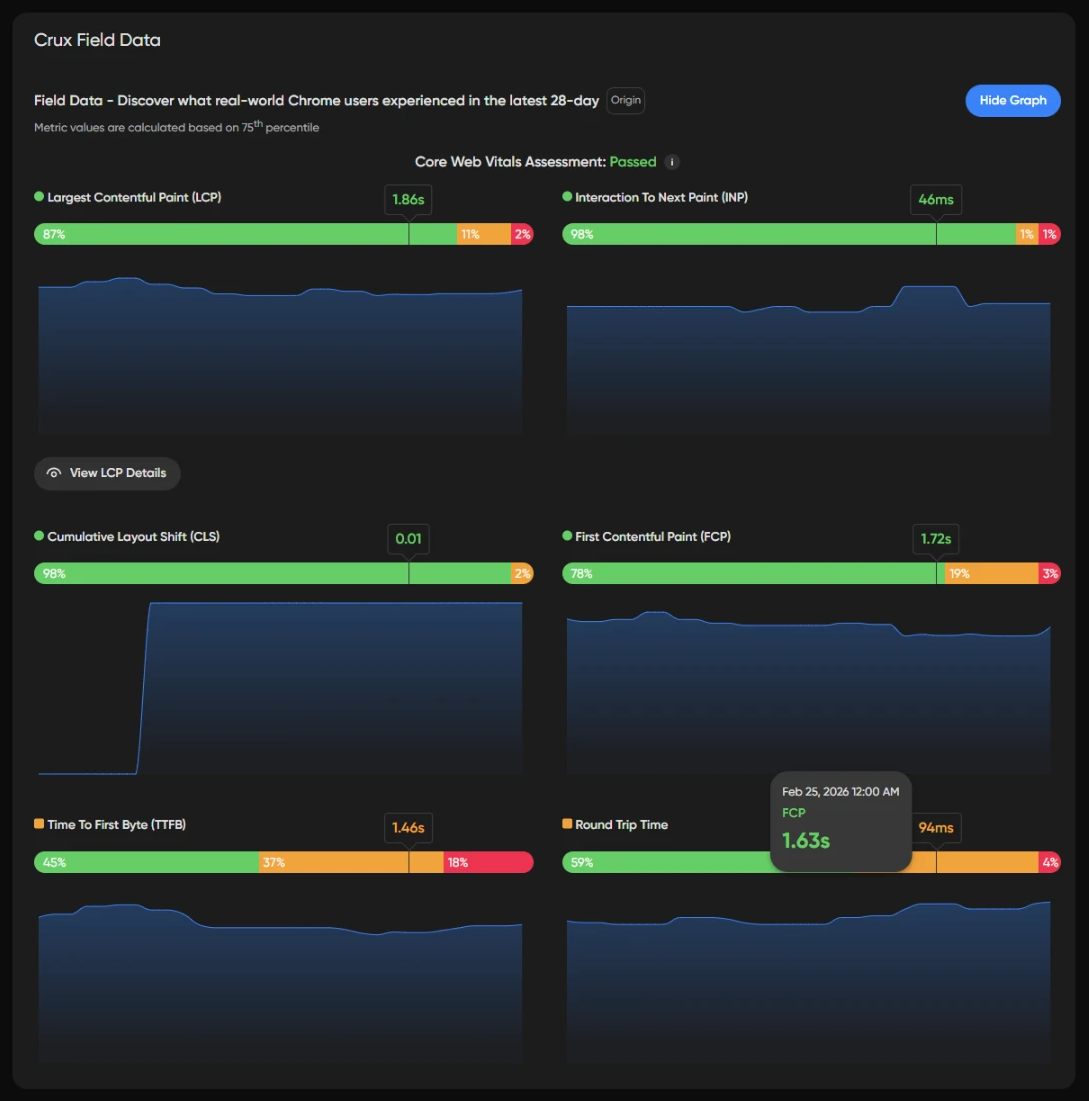
CrUX is a public dataset of real user experience data collected from opted-in users in the field. It measures Core Web Vitals, including Largest Contentful Paint (LCP), First Input Delay (FID), and Cumulative Layout Shift (CLS), along with diagnostic metrics like Time to First Byte (TTFB), First Contentful Paint (FCP) and Round Trip Time (RTT).
For detailed explanations of how each of these scores are calculated read more in Performance and Health Metrics.
Load and Rendering Times
loading-times.jpg
This chart highlights three key metrics that impact how quickly content appears on the screen. Start Render measures the time from initial navigation to when the first non-white content is displayed, indicating how quickly users begin seeing content. DOM Content Loaded tracks the time until the browser finishes loading the initial HTML, while First Meaningful Paint (FMP) captures the point when the most significant above-the-fold content is rendered. These metrics help you understand how long users wait before meaningful content is visible and ready to interact with.
For detailed explanations of how each of these scores are calculated read more in Performance and Health Metrics.
Content Requests and Sizes
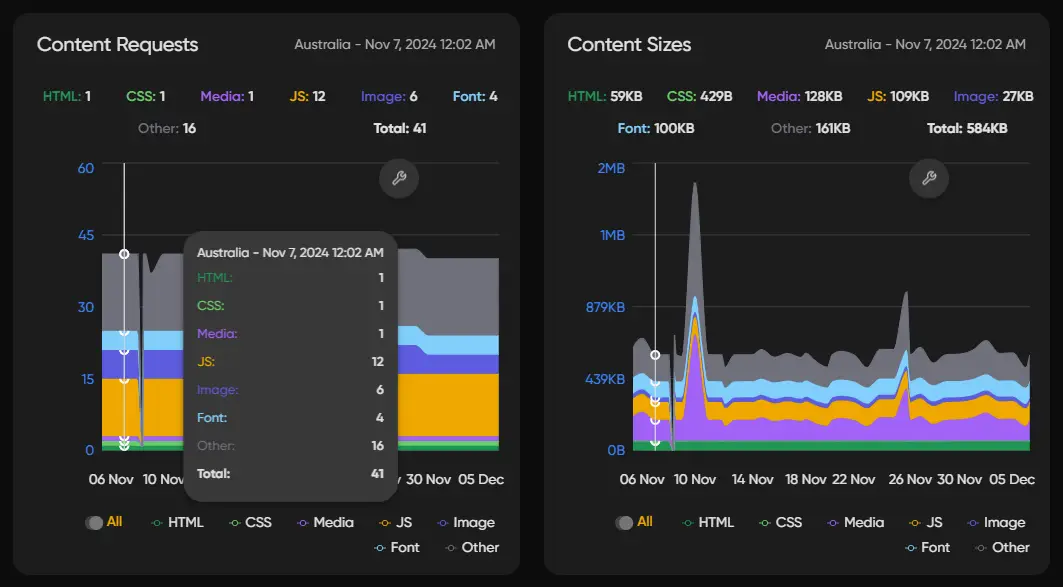
The Content Requests and Content Sizes sections display graphs that provide a visual breakdown of how many resources are requested by your page and the size of each resource. These graphs help you understand the load impact of various elements, such as images, scripts, and stylesheets, allowing you to identify areas where optimizations can reduce load times and improve overall page performance.
Lighthouse Improvements
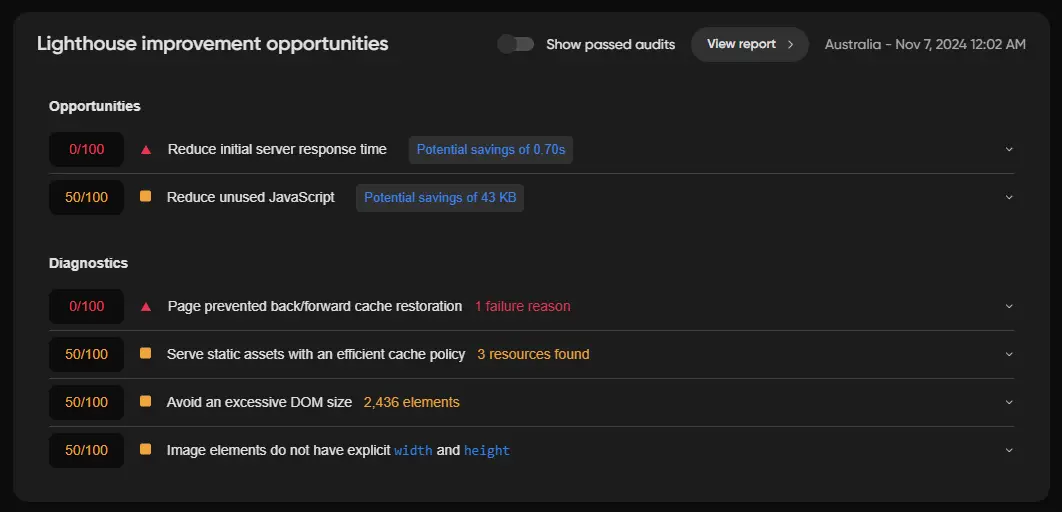
The Opportunities section in the Lighthouse report offers detailed suggestions, along with documentation, to help you implement improvements. Additionally, the Diagnostics section provides further guidance for developers, offering insights to enhance performance beyond the core recommendations.
Lab Test Info
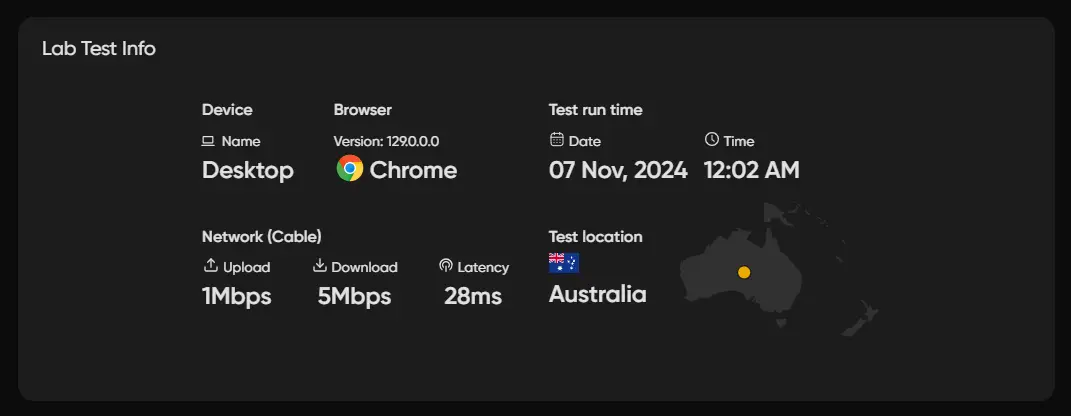
The Lab Test Info section provides key details about the environment in which your performance tests are conducted. It includes information such as the device type, browser version, network conditions (e.g., 4G or Wi-Fi), and test location. These details help you understand the testing context, allowing you to compare lab results with real-world performance data and ensure accurate analysis.