Competitive Benchmarking
Competitive Benchmarking allows you to measure your site’s performance against your key competitors. By comparing critical performance metrics, you can gain insights into how your site stacks up in terms of Loading Speed, Accessability, SEO, and security. This helps you identify areas where you may be falling behind and find opportunities for improvement, ensuring your site stays competitive.
Niteco Performance Insights can collect performance data from both your site and your selected competitor sites. You can track and compare any metric on the platform such as Lighthouse scores or specific metrics like Time to First Byte (TTFB), Largest Contentful Paint (LCP) or Cumulative Layout Shift (CLS) for example. By visualizing these metrics side by side, you’ll be able to pinpoint specific areas where your competitors outperform you and take actionable steps to improve.
Lets see how your site performs in comparison to your major competitor by adding an additional site to your project and comparing the results of both sites in the benchmark dashboard.
Let’s get started!
1. Add Competitor's Site
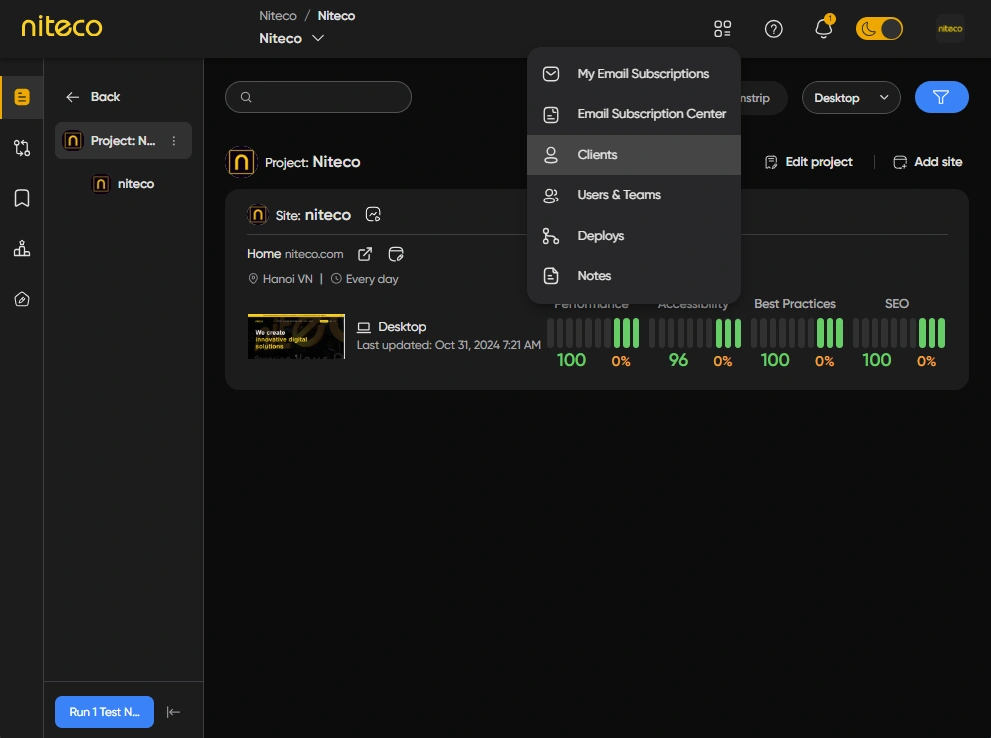
To add a new site to your project, click on Clients in the top settings menu:
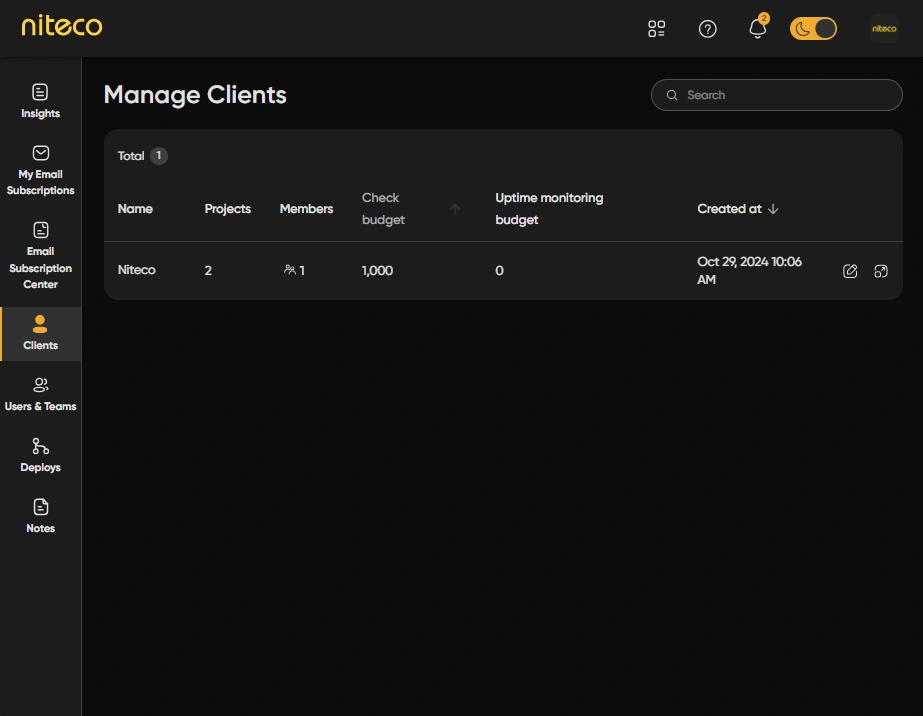
Click on the client you wish to add your competitor's site to:
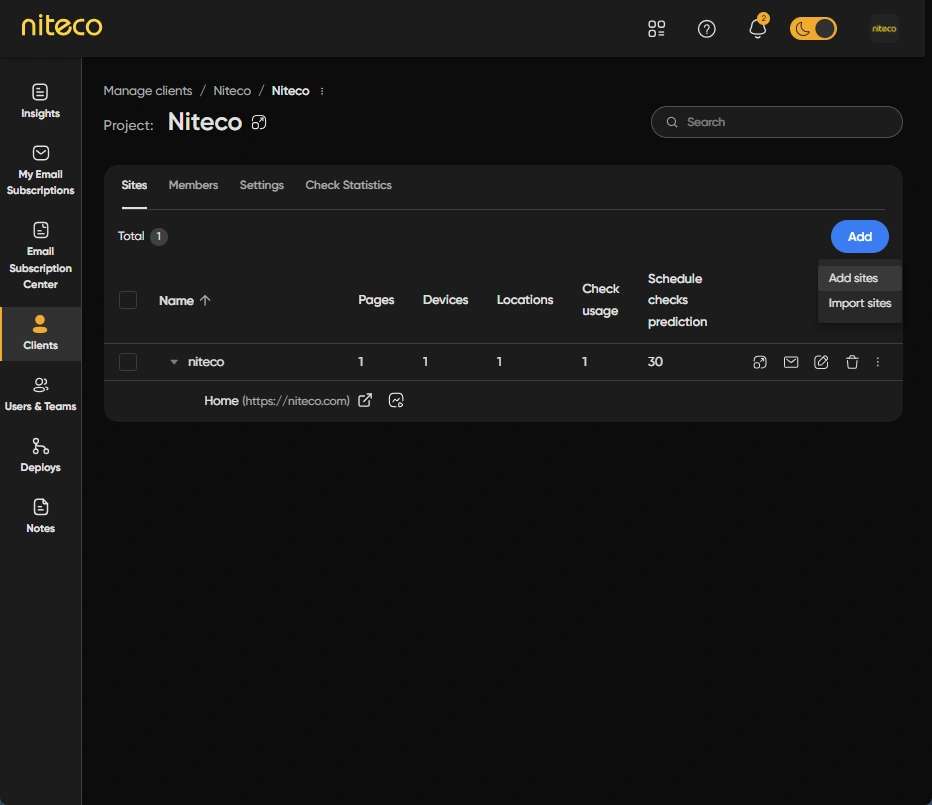
Click on Add and select Add Sites to open the new site form:
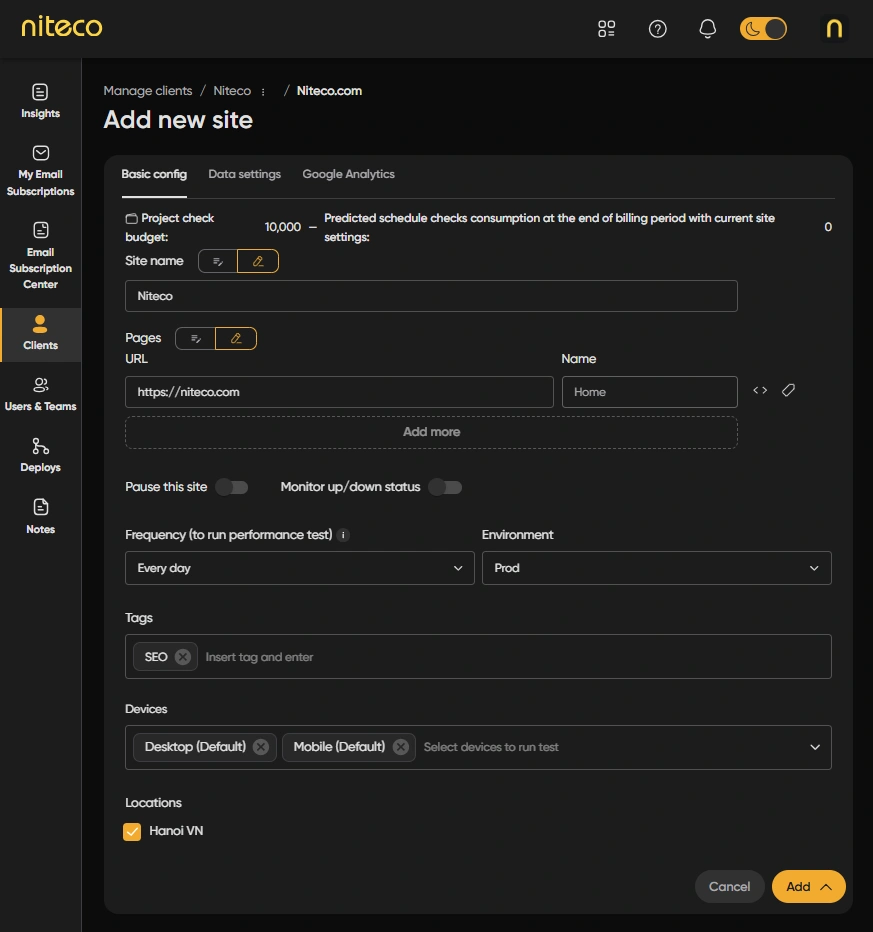
Once you have added your site to the project you will now see two sites in the project settings page:
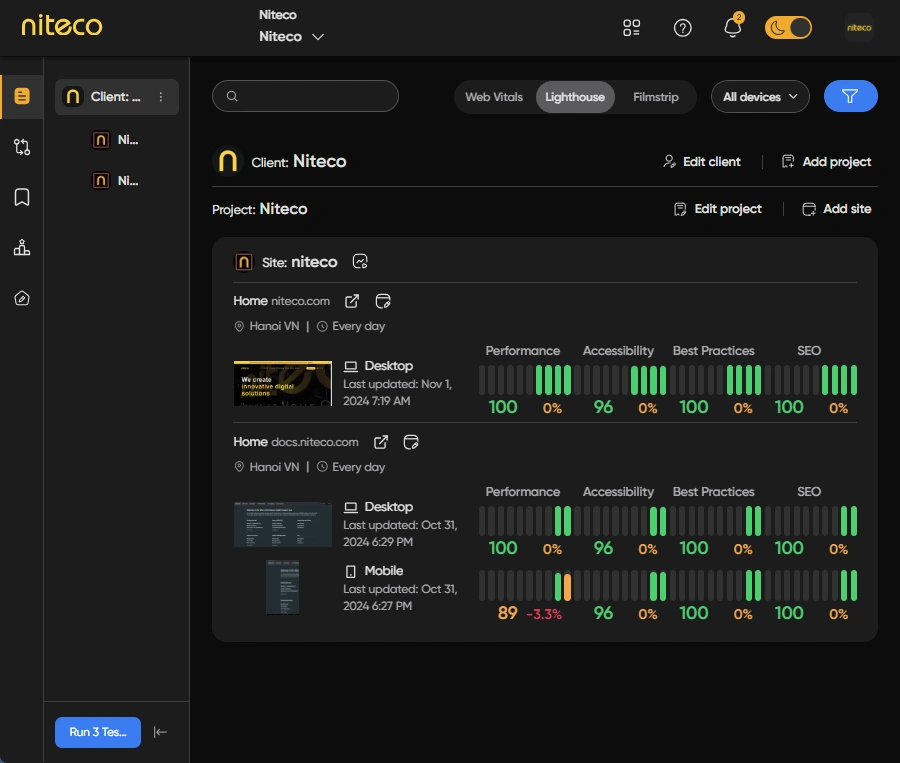
InfoFor an in-depth explanation of how to add sites to your projects please refer to our Manage Sites guide.
2. Run Tests
Now that you have added your competitor’s site and pages you must then run the site’s tests in order to get audit data to compare them with your site. You can run tests by navigating to the Insights Dashboard and click on “Run Tests Now” in the bottom left of the screen.
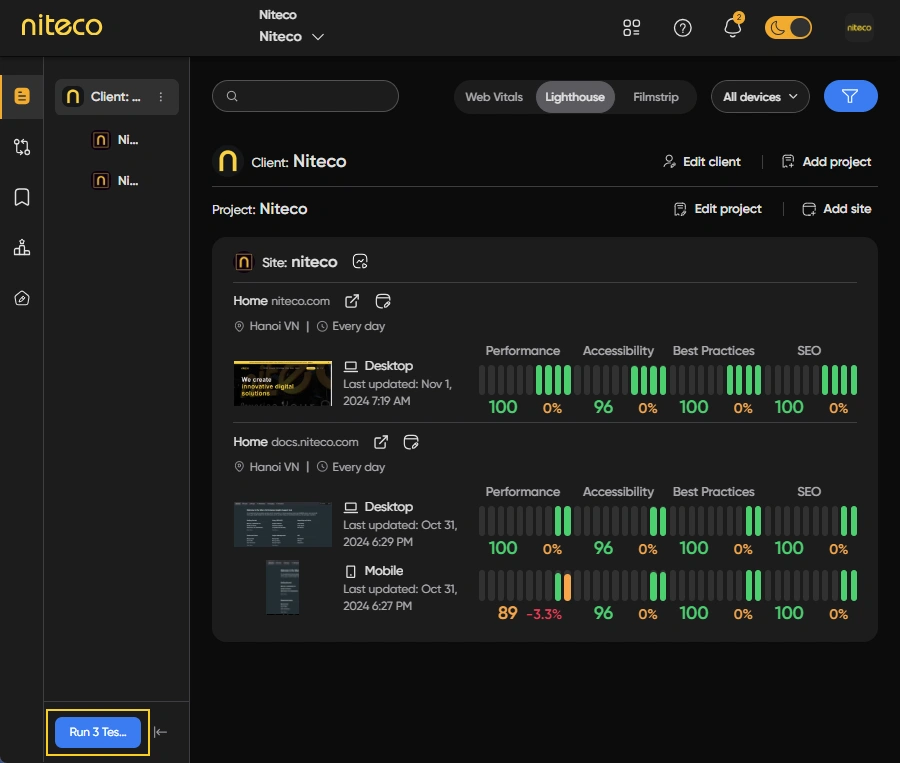
This will run tests on all pages of the new site that was added to the project.
Alternatively, you can navigate to a page and of your site and click on Run Test to run a test on that individual page.
3. Compare Sites
To compare your site with your competitor's, navigate to the Insights Dashboard and select the project which contains the sites that you wish to compare. Once your project is selected click on the Benchmark icon in the main left navigation:
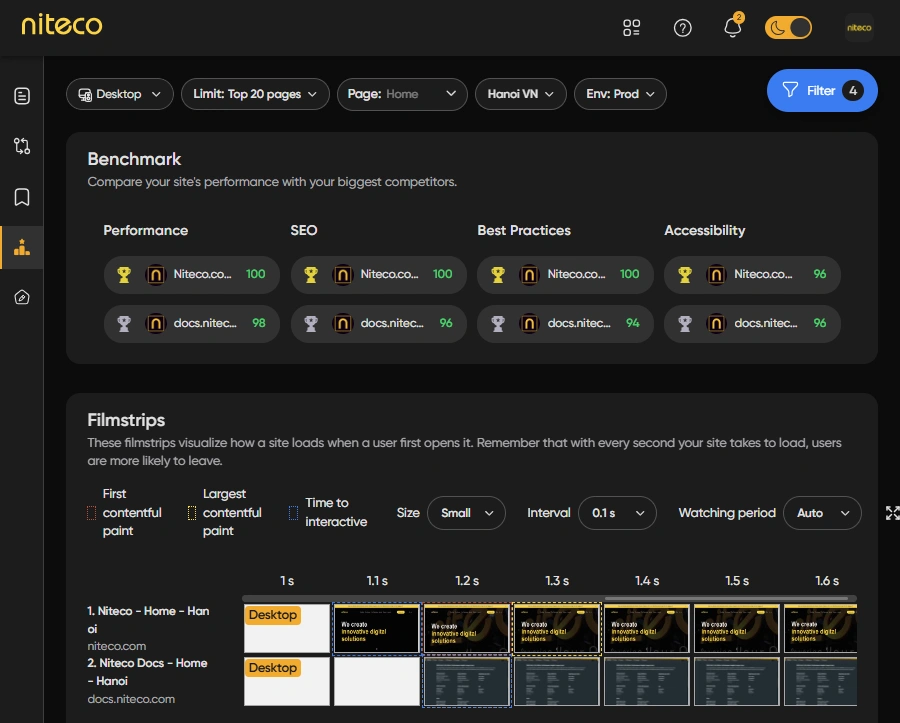
The Benchmark page compares key metrics in several sections:
Lighthouse Scores
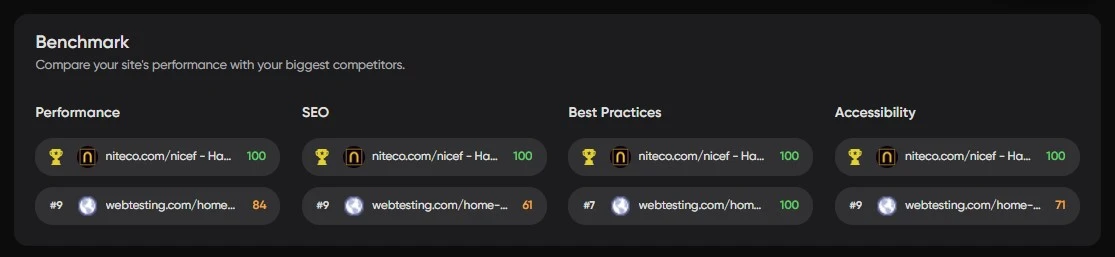
The Lighthouse section, showing how your Performance, SEO, Best Practices and Accessibility compares to you competitor.
InfoFor an in-depth explanation of Lighthouse refer to our Lighthouse guide.
Filmstrips
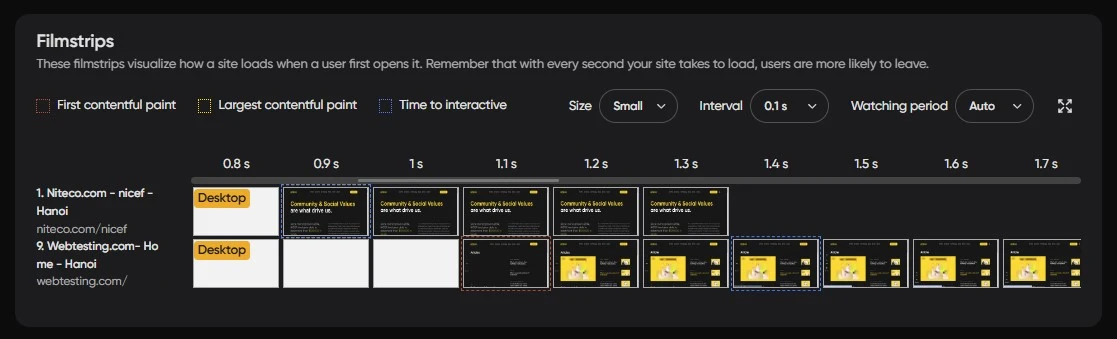
The Filmstrips section compares how sites load visually in the browser.
InfoFor an in-depth explanation of Lighthouse refer to our Filmstrip guide.
Web Vitals
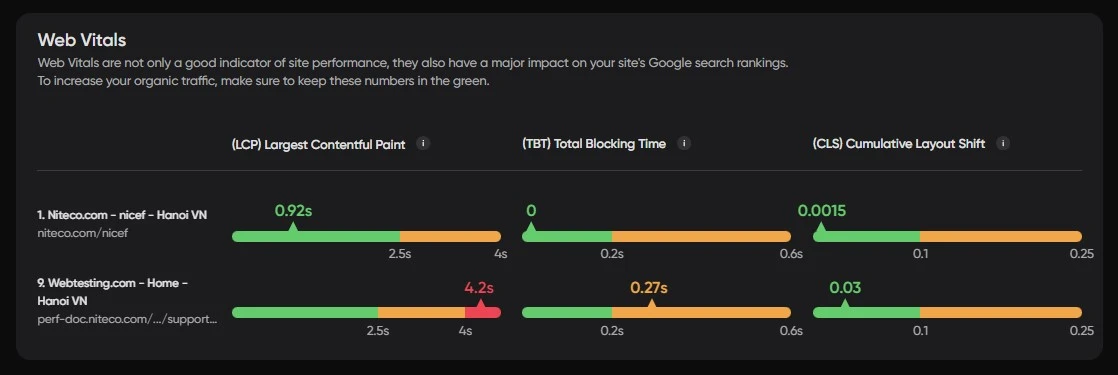
The Web Vitals section compares different loading speed metrics to show how each site compares in regards to Largest Contentful Paint, Total Blocking Time and Cumulative Layout Shift.
InfoFor an in-depth explanation of Lighthouse refer to our Web Vitals guide.
CrUX Field Data
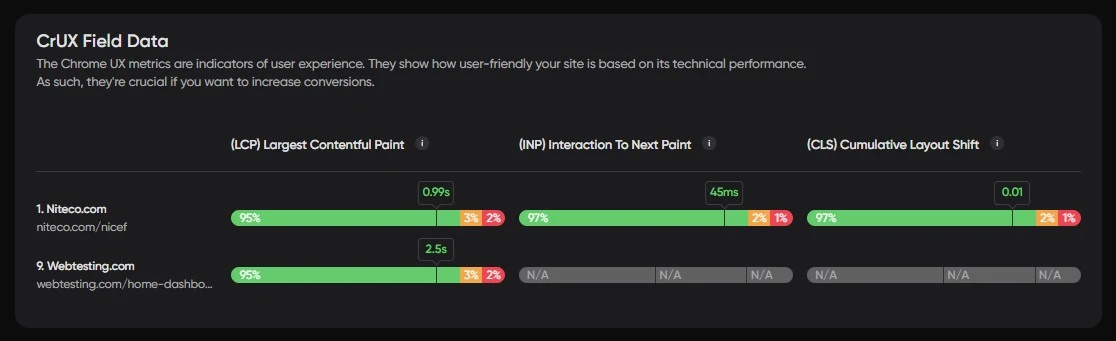
The CrUX section compares real user data statistics of the sites.
Please note that CrUX data will only be shown if there is real user data available.
InfoFor an in-depth explanation of Lighthouse refer to our CrUX guide.
Site Requests
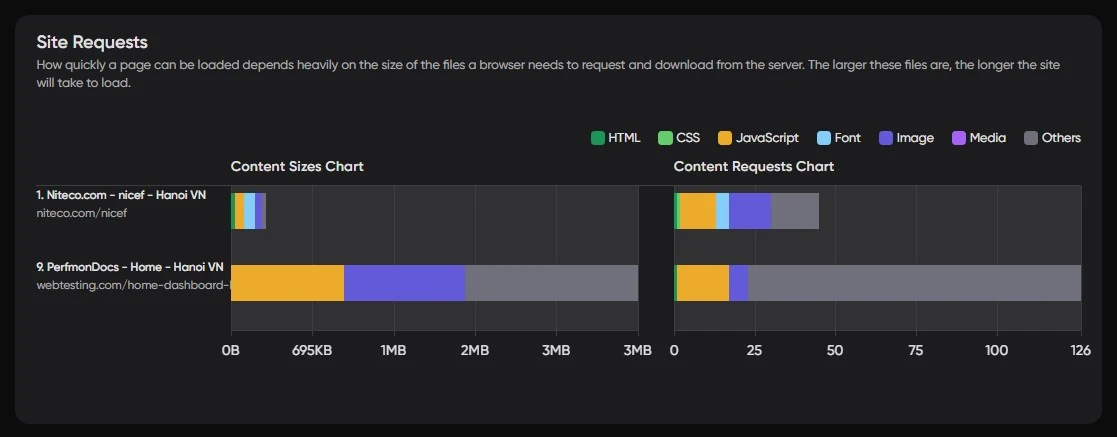
The Site Requests section compares the sizes of resources that each site loads. Reducing the size of resources can significantly improve the loading speed and other metrics of a site.