Javascript Performance
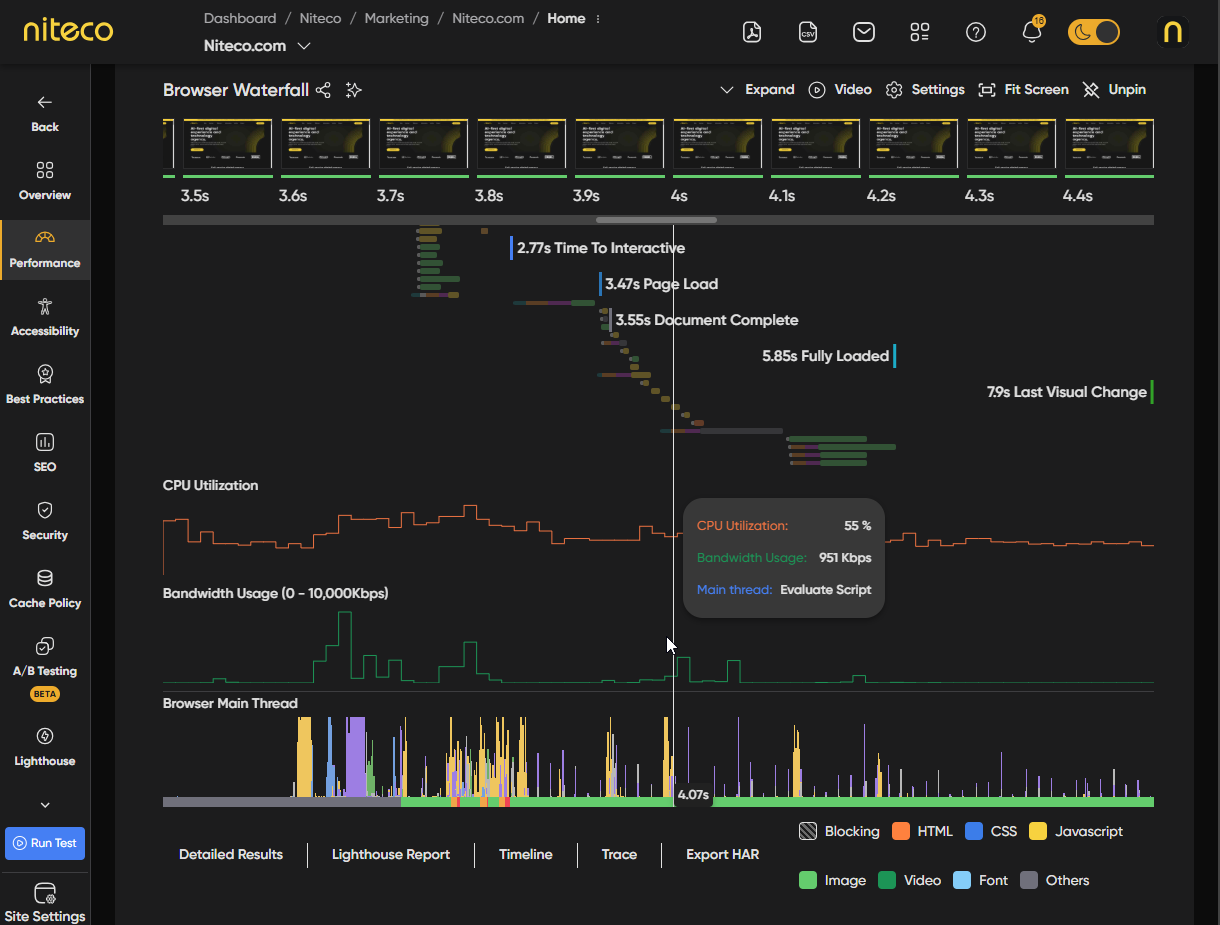
The JavaScript Performance section visualizes browser activity at each stage of the page load. Hover over the timeline to inspect CPU utilization, bandwidth consumption, and main thread processes at any given point. This helps identify bottlenecks such as heavy script execution, network congestion, or long tasks blocking rendering.
CPU Utilization
The percentage of CPU being used by the browser at each point during the page load. High CPU utilization can indicate heavy JavaScript execution, complex layout calculations, or intensive rendering operations that may delay interactivity.
Bandwidth Usage
The network bandwidth consumed by the browser during the page load. This shows when and how much data is being downloaded, helping you identify large resource transfers, render-blocking requests, or inefficient loading sequences.
Browser Main Thread
A visual breakdown of what the browser's main thread is doing at each moment during the page load. This includes parsing, scripting, rendering, painting, and idle time. Long uninterrupted blocks of activity indicate long tasks that can block user interaction and delay metrics like First Input Delay (FID) and Total Blocking Time (TBT).
Updated about 2 months ago